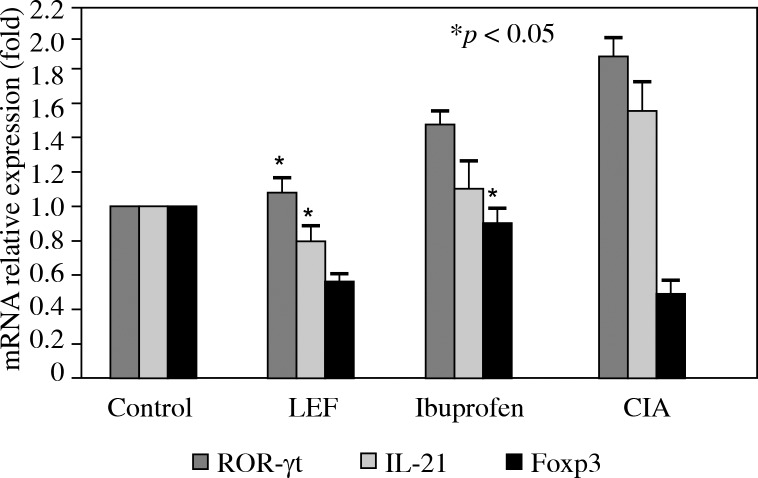
Fig. 2.
The expression of ROR-γt, IL-21 and Foxp3 mRNA in mouse spleen. Splenocytes were collected on day 28 and RT-PCR were performed to detect the ROR-γt, IL-21 and Foxp3 mRNA expression. Relative expression levels of mRNA were measured by quantitative real-time RT-PCR using the ΔΔ Ct method with the GAPDH mRNA as an internal control. The results shown represent the mean ± SD of 3 independent experiments. *p < 0.05 compared to the CIA model

