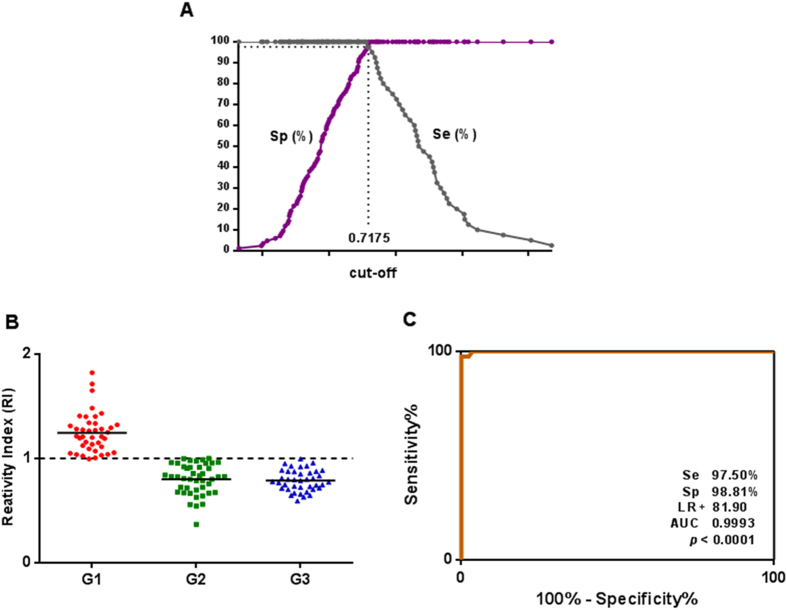
Figure 4. Sandwich ELISA using scFv to detect immune complexes in serum samples.
(A) TG-ROC indicating the optimal cut-off of the method. (B) Reactivity indices of sera from individuals with strongyloidiasis (G1, n = 40), other parasitic diseases (G2, n = 44) and healthy individuals (G3, n = 40). (C) ROC curve showing sensitivity (Se), specificity (Sp), positive likelihood ratio (LR+) and area under the curve (AUC) (P < 0.001). The horizontal lines separating the data represent the median and dashed line indicates the threshold of the reactivity index.

