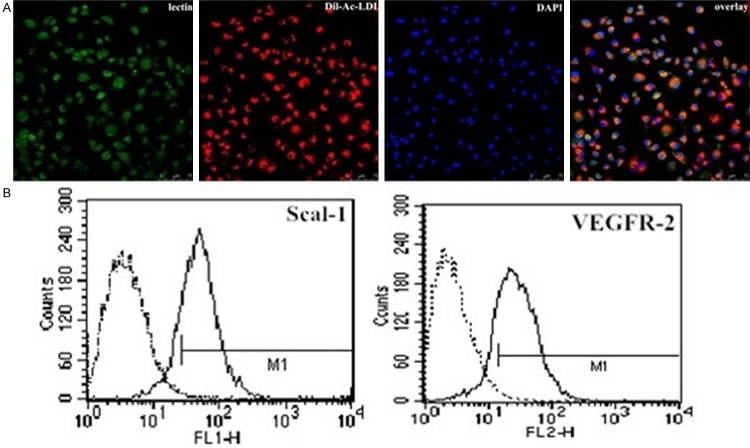
Figure 1.
The isolation and characterization of EPCs. A. EPCs stained with Dil-Ac-LDL, lectin, and DAPI. B. FACS analysis of primary EPCs cultured for 5-7 days. FACS analysis of cultured EPCs for FITC-Sca-1 and VEGFR2, representing a stem/progenitor cell marker and endothelial cell marker, respectively. Positive cells were 81.53 ± 3.96% (n = 3) for Sca-1 expression and 49.72 ± 2.58% (n = 3) for VEGFR2 expression. The left peak in each box denotes corresponding negative isotype control labeling, and the positive gate M1 is shown.

