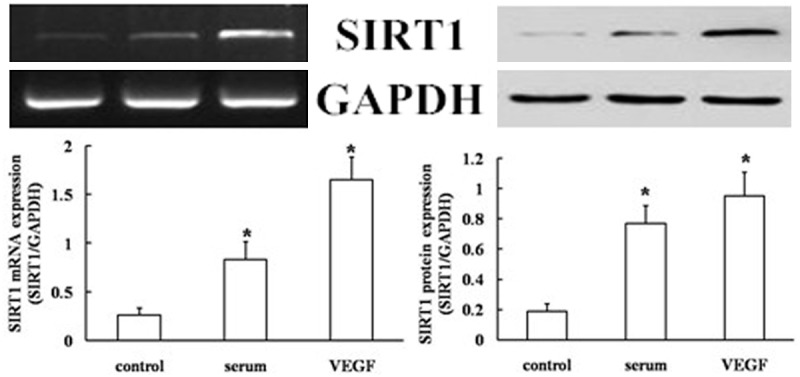
Figure 2.

SIRT1 expression in EPCs. Protein and mRNA levels of SIRT1 in EPCs using western blotting and RT-PCR analysis. Values are the percentage of GAPDH (serum- and VEGF-free, null treatment). Representative images from semi-quantitative RT-PCR and western blots. Data are expressed as mean ± SD of three independent experiments done in triplicate, with *P < 0.05 compared with the controls.
