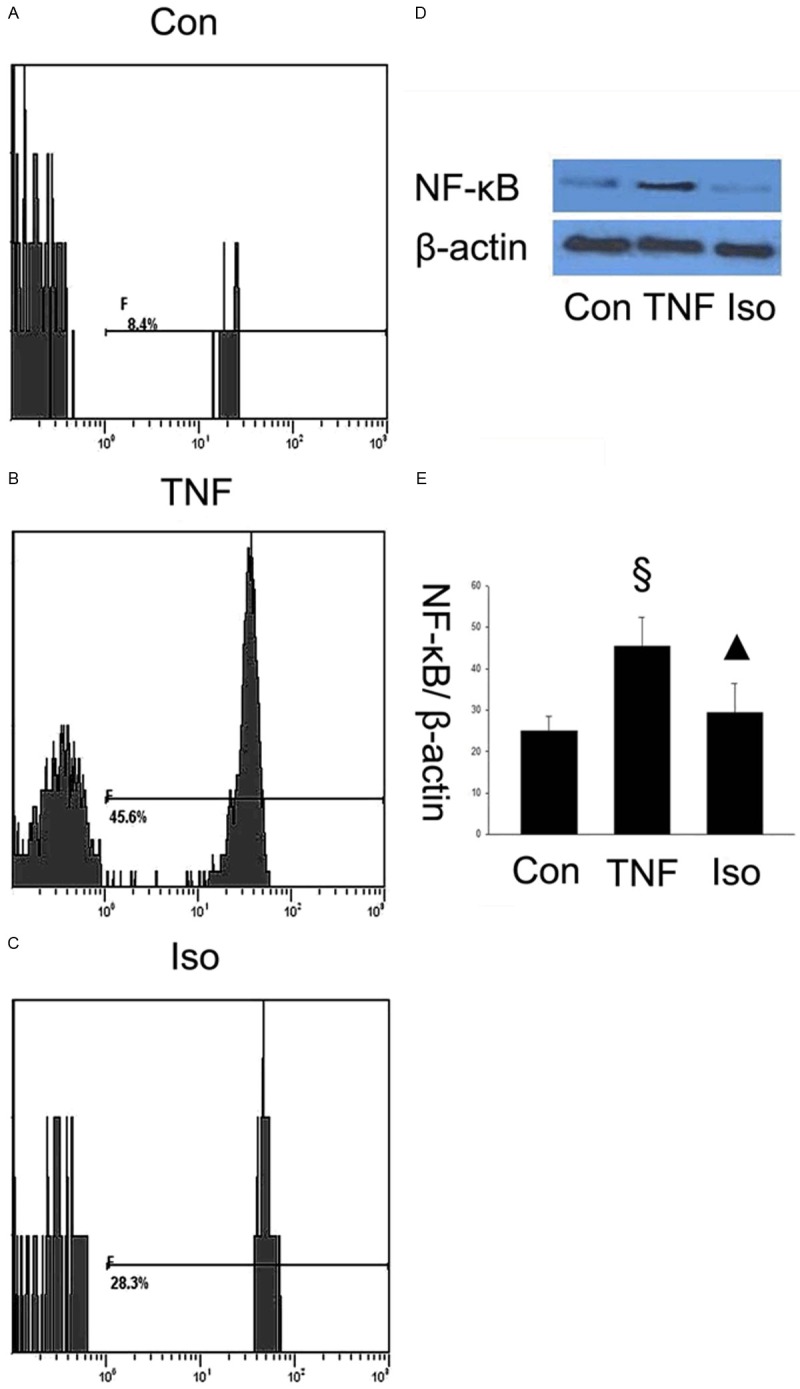
Figure 7.

Isorhamnetin suppressed NF-κB pathway activation. A. Expression of NF-κB in control group was measured by a flow cytometry assay; B. Expression of NF-κB in TNF-α group was measured by a flow cytometry assay: C. Expression of NF-κB in isorhamnetin group was measured by a flow cytometry assay; D. 40 µg HUVECs lysates in control, TNF-α and isorhamnetin groups were loaded onto an SDS-polyacrylamide gel and NF-κB were detected by Western blotting. Equal loading of proteins were confirmed by reprobing blots with antibodies against β-actin; E. Quantitation of NF-κB expression of HUVECs. §P < 0.05 vs. control group, ▲P < 0.05 vs. TNF-α group. Data shown are means ± SE representative of 4 independent experiments.
