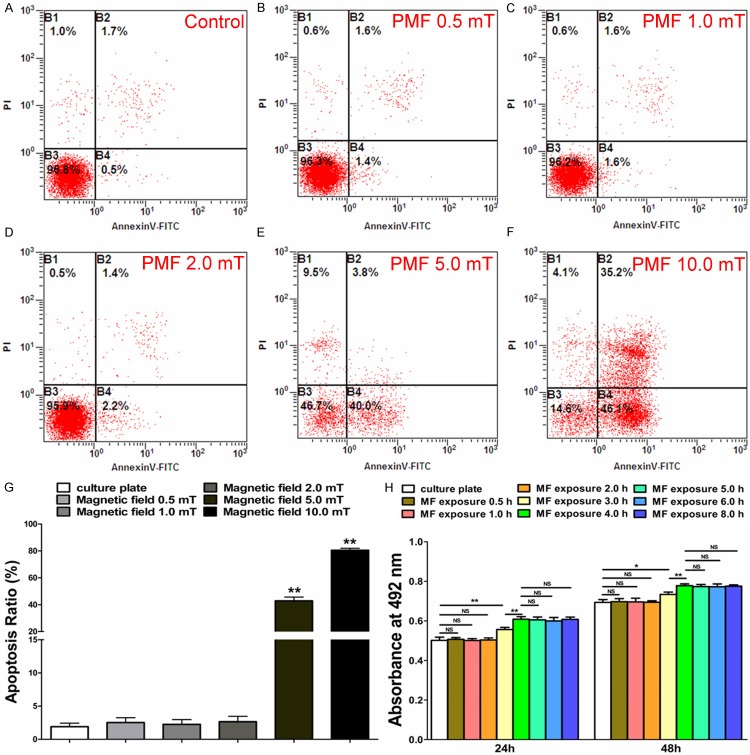
Figure 2.
Detection of apoptosis and proliferation in SCs. A-F: Flow cytometry assay of apoptosis in SCs following different PMF gradients (0.5 mT, 1.0 mT, 2.0 mT, 5.0 mT, 10.0 mT and 50 Hz). G: The percentage of apoptotic cells in each group was showed by averaging the results of four flow cytometry assays for each group. H: CCK-8 values of 24 h and 48 h after PMF exposure were obtained by averaging the results of four samples for each group. All data were expressed as the mean ± SEM. *P < 0.05, **P < 0.01.

