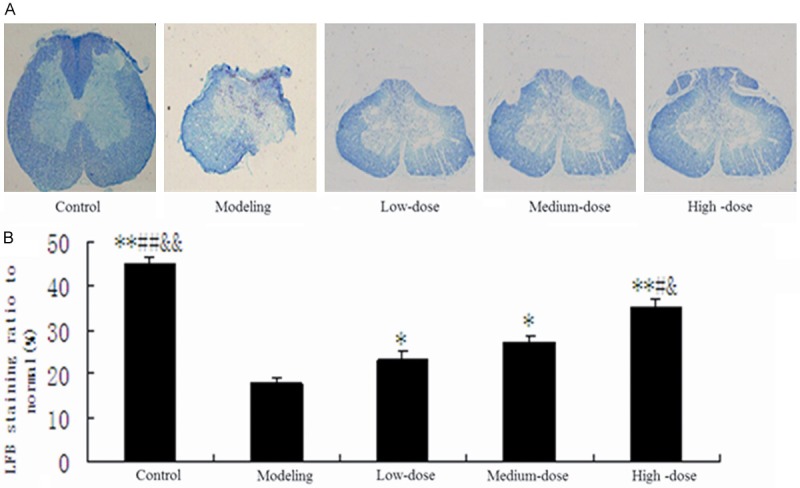
Figure 4.

The results of LFB staining. A. The photos of LFB staining for spinal cord myelin; B. LFB staining ratio to normal. **P < 0.01 vs. modeling group; *P < 0.05 vs. modeling group; ##P < 0.01 vs. low-dose group; #P < 0.05 vs. low-dose group; &&P < 0.01 vs. medium-dose group; &P < 0.05 vs. medium-dose group LFB, Luxol-fast-blue.
