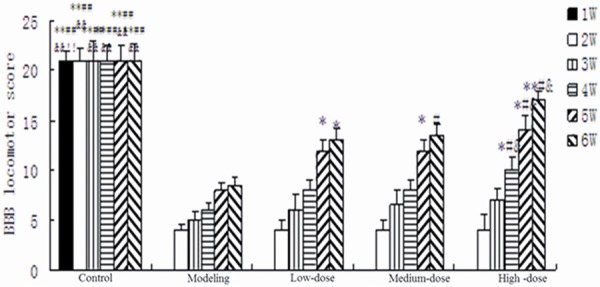
Figure 6.

The results of behavioral assessments using BBB test. **P < 0.01 vs. modeling group; *P < 0.05 vs. modeling group; ##P < 0.01 vs. low-dose group; #P < 0.05 vs. low-dose group; &P < 0.05 vs. medium-dose group; $P < 0.05 vs. medium-dose group; BBB, Basso Beattie Bresnahan.
