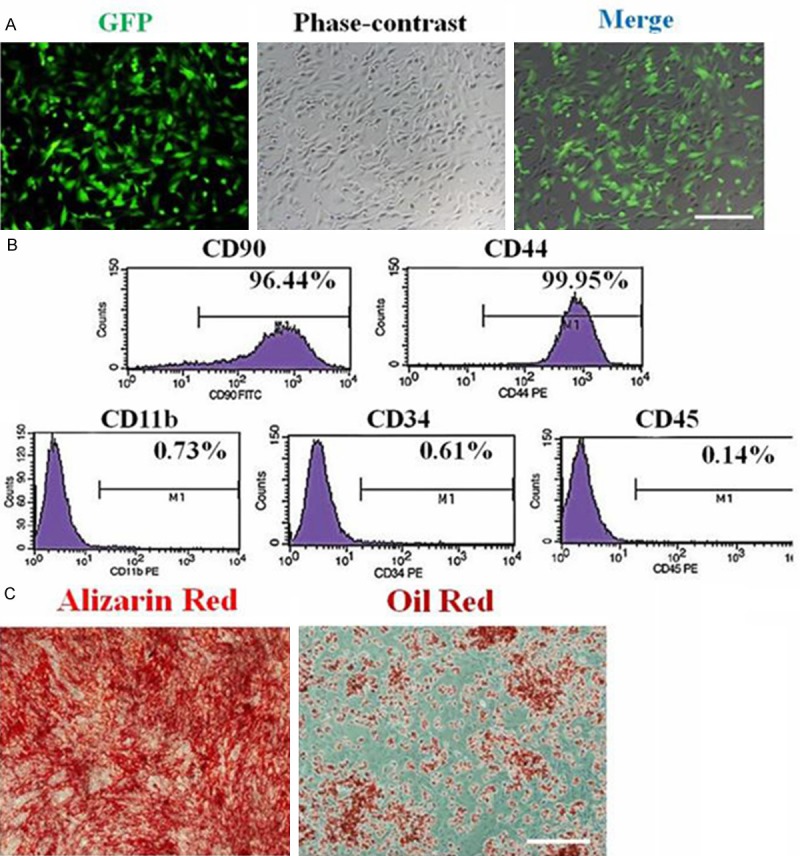
Figure 1.

Characterization of rat GFP-MSCs in vitro. A. Morphological characteristics of GFP-MSCs at P3 under fluorescence and phase-contrast microscopy. Scale bar = 100 μm. B. Immunophenotype analysis of GFP-MSCs at P3 by flow cytometry. Adherent MSCs are positive for CD90 and CD44, but negative for CD11b, CD34 and CD45. C. Osteogenic differentiation as indicated by the formation of mineralized matrix shown by alizarin red staining. Adipocytic differentiation was noted by the presence of broadened morphology and formation of lipid vacuoles (positive oil-red O staining). Scale bars = 100 μm.
