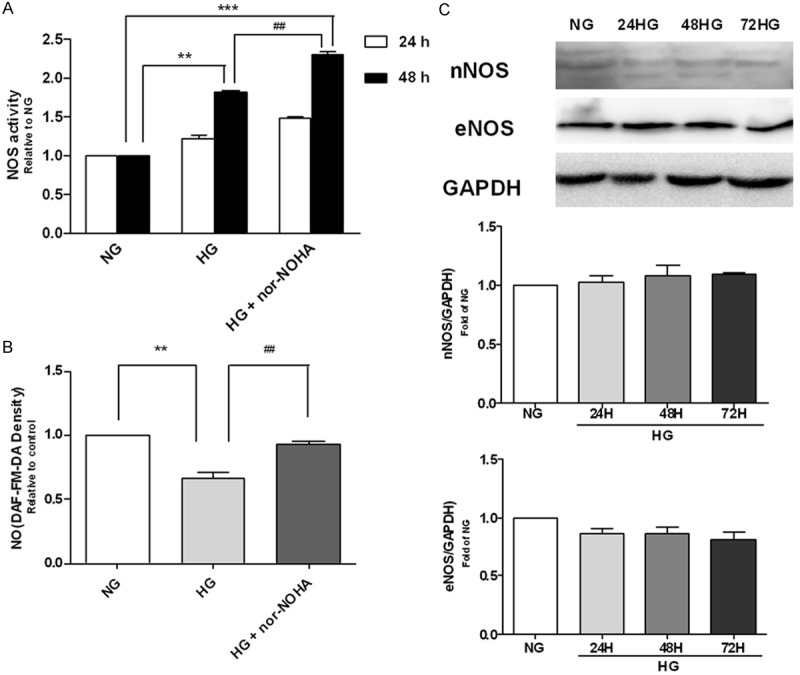
Figure 3.

NO production and NOS activity in H9c2 cells exposed to high glucose. A. NO amounts in H9c2 cells exposed to normal glucose (NG, 5.56 mM) and high glucose (HG, 35 mM) for 48 h. B. Activity of NOS in H9c2 cells exposed to normal glucose (NG, 5.56 mM) and high glucose (HG, 35 mM) for 24 h and 48 h. nor-NOHA, the arginase inhibitor. C. Western blot with anti-nNOS and anti-eNOS antibody of cellular proteins from H9c2 cells exposed to high glucose for 24 h, 48 h, and 72 h. **P<0.01 vs. NG; ***P<0.001 vs. NG; ##P<0.01 vs. HG.
