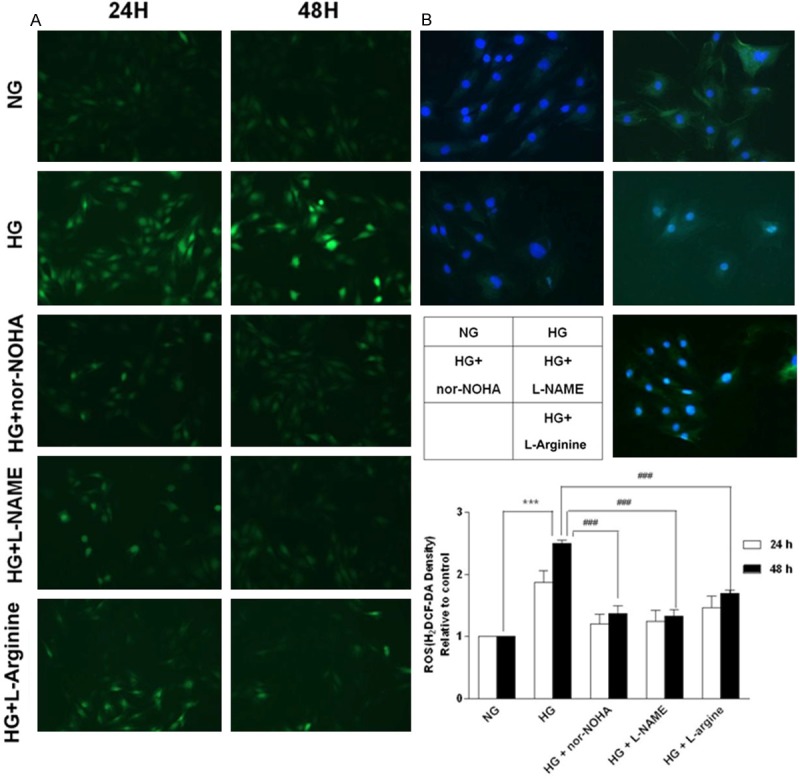
Figure 4.

Assessment of oxidative/nitrosative stress of H9c2 cells exposed to high glucose. A. Reactive oxygen species (ROS) generation at different time points. B. Immunocytology with an anti-nitrotyrosine antibody of cellular proteins from H9c2 cells exposed to high glucose for 48 h. NG = normal glucose (5.56 mM), HG = high glucose (35 mM); nor-NOHA, the arginase inhibitor; L-NAME, the NOS inhibitor. Data were obtained from three independent experiments. ***P<0.001 vs. NG; ###P<0.001 vs. HG.
