
Figure 1.
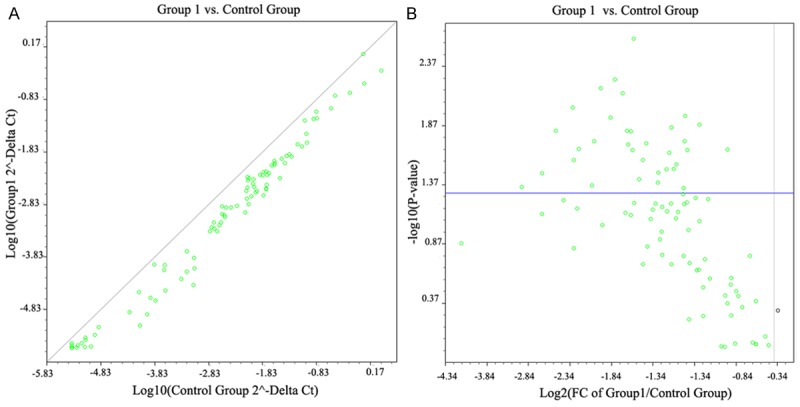
The scatter diagram and volcanic figure of Ct values in case and control group. A: The left figure stands for the Ct of log 10 P-value; B: The right figure stands for the Ct of log 2 fold change.
Official websites use .gov
A
.gov website belongs to an official
government organization in the United States.
Secure .gov websites use HTTPS
A lock (
) or https:// means you've safely
connected to the .gov website. Share sensitive
information only on official, secure websites.
The scatter diagram and volcanic figure of Ct values in case and control group. A: The left figure stands for the Ct of log 10 P-value; B: The right figure stands for the Ct of log 2 fold change.