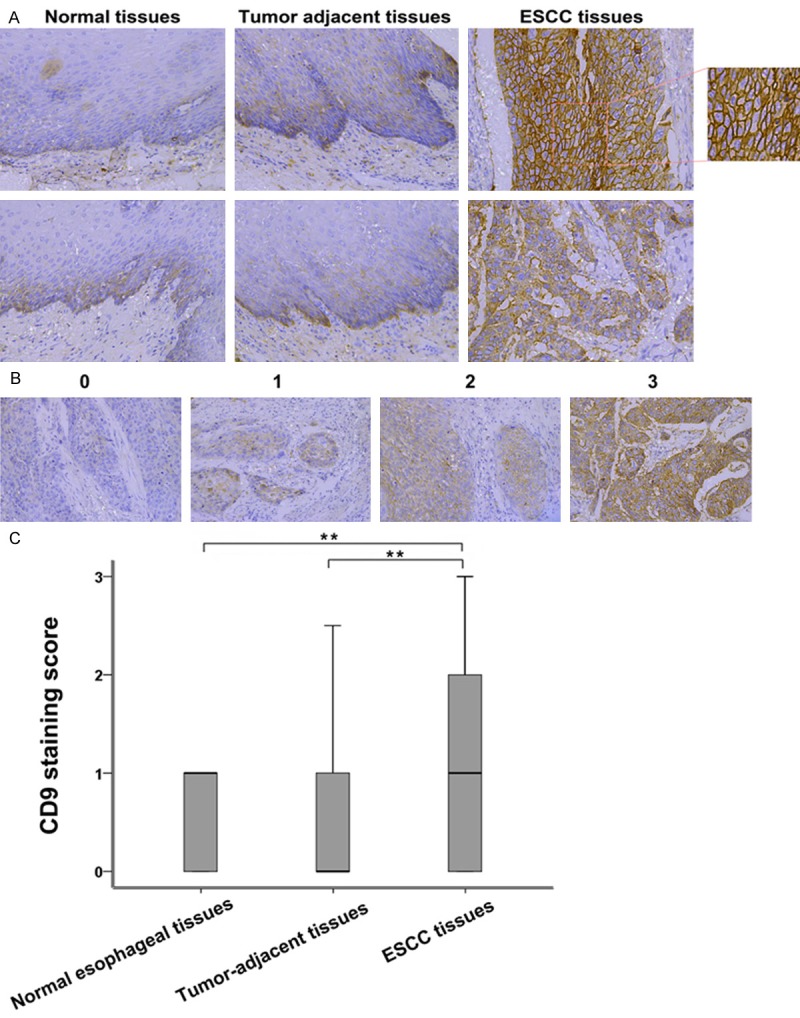
Figure 1.

Overexpression of CD9 in ESCC tissues. A. Representatives IHC analysis of CD9 expression in normal esophageal tissue specimens, ESCC adjacent tissues and ESCC tissues. B. Representative images of IHC staining illustrating the scoring of CD9 in ESCC tissues (magnification, × 200). C. Box plot representing the range of CD9 immunohistochemical (IHC) staining score in normal esophageal tissues (n = 15), ESCC tissues (n = 104) and tumor adjacent tissues (n = 52), **(P < 0.01).
