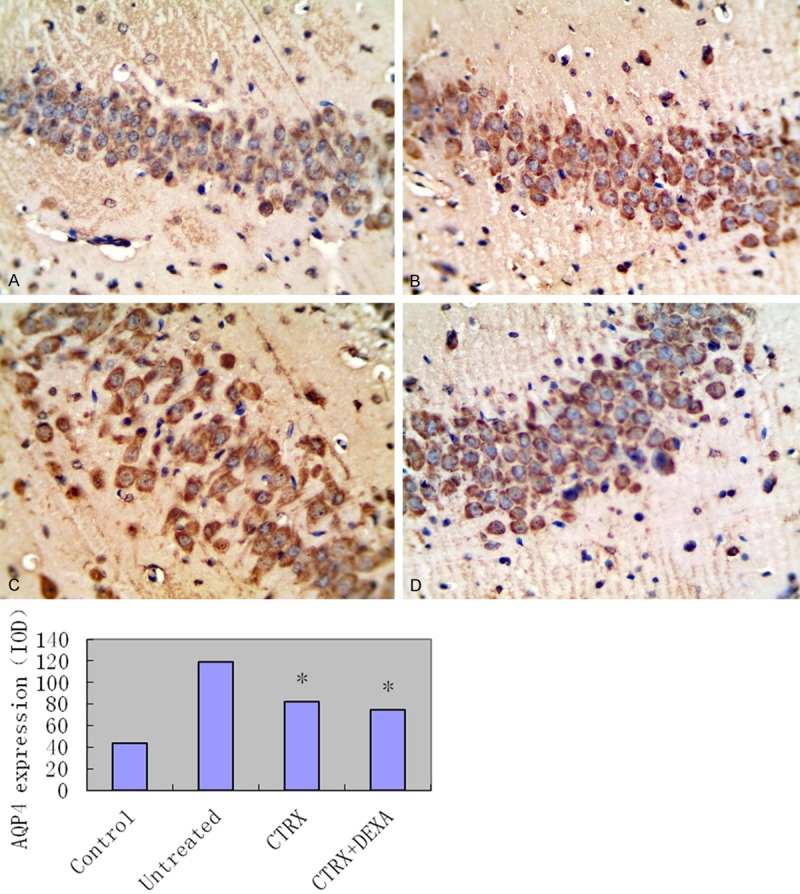
Figure 1.

Upper panel: representative picture of the Immunohistochemistry stain for AQP4 expression of hippocampus tissue in different treatment groups. A: Hippocampus tissue of saline control group; B: Hippocampus tissue of untreated group; C: Hippocampus tissue of CTRX treatment group; D: Hippocampus tissue of CTRX + DEXA treatment group. All slides were using DAB as the chromogenic reagent and counterstained with hematoxylin. All pictures were taken under high magnification of 400X. Lower panel: Integrated optical density of immunohistochemistry of Aquaporin-4 (AQP4) expressions in four groups: 1 saline control group; 2 untreated group; 3 Ceftriaxone treatment group (CTRX group); 4 Ceftriaxone plus Dexamethasone group (CTRX + DEXA group). Compared CTRX group with both untreated and CTRX + DEXA group, P value is less than 0.05. Compared CTRX + DEXA group with saline group, P value is more than 0.05.
