Figure 6.
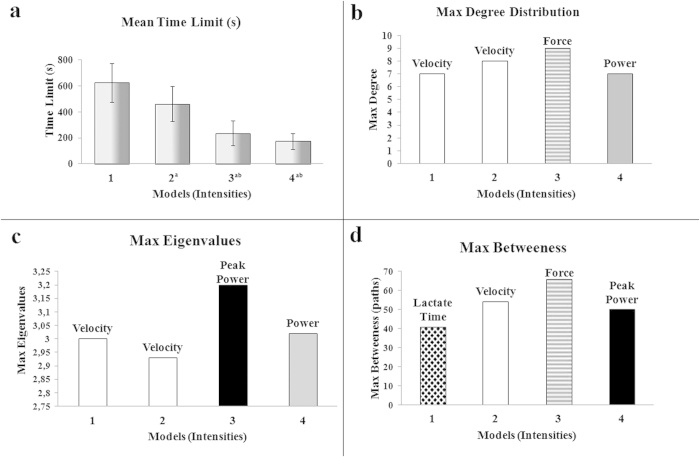
(a) Mean time limit and ±s.d. in which time until fatigue was inversely proportional to effort intensity, a Substantial difference between intensity 1, b intensity 2 , c intensity 3. (One-way ANOVA followed by Student-Newman-Keuls test, n = 9, P < 0.05). (b) Max degree distribution, hub nodes that are more correlated and therefore connected to others. (c) Max eigenvalues, at lower efforts (Models 1 and 2), velocity had major contributions; at higher efforts, force and power had greater value and contribution. (d) Max Betweenness, which considers the flow of information across nodes; the betweenness centrality was greater in model 3, with the main mechanical contribution; in model 4, Peak Power was the most influential. Max degree distribution: it appoints the major influent nodes, with the greater number of connections (hub nodes); Max Eigenvalue: the maximum eigenvalue of a network meaning the gravitational pull exerted by each node on the overall network. Higher eigenvalues mean more influence over other body systems. An eigenvalue greater than 1.0 means the network is unstable, though; an eigenvalue of zero means the node has no influence. The betweenness centrality: the amount of control exerted by links over the flow of information, expressed in terms of paths.

