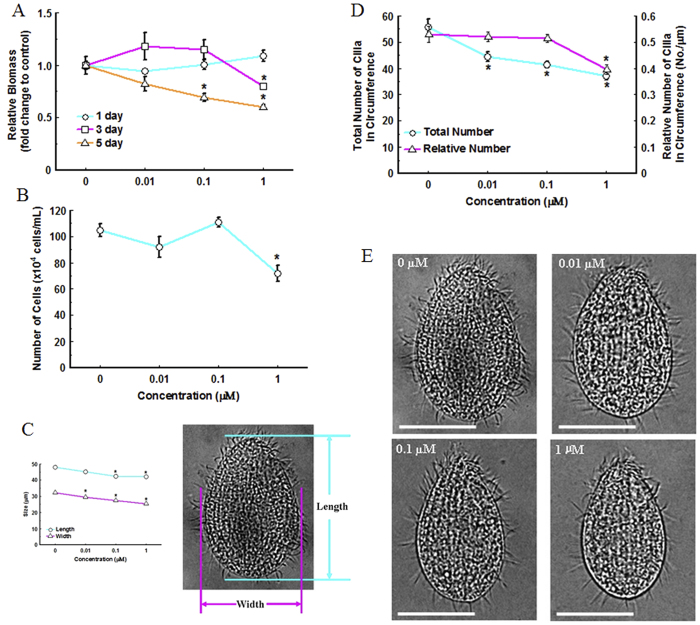
Figure 2.
Dose-dependent effects on relative biomass (A), cell density (B), body size (C) and cilia quantity (D) and represented images (bar = 20 μM) (E) after exposure to 0, 0.01, 0.1 or 1 μM TDCPP for 5 days. Values represent mean ± SEM. Significant differences from the control are indicated by *P < 0.05. Each concentration contains 3 biological replicate.

