
Figure 6.
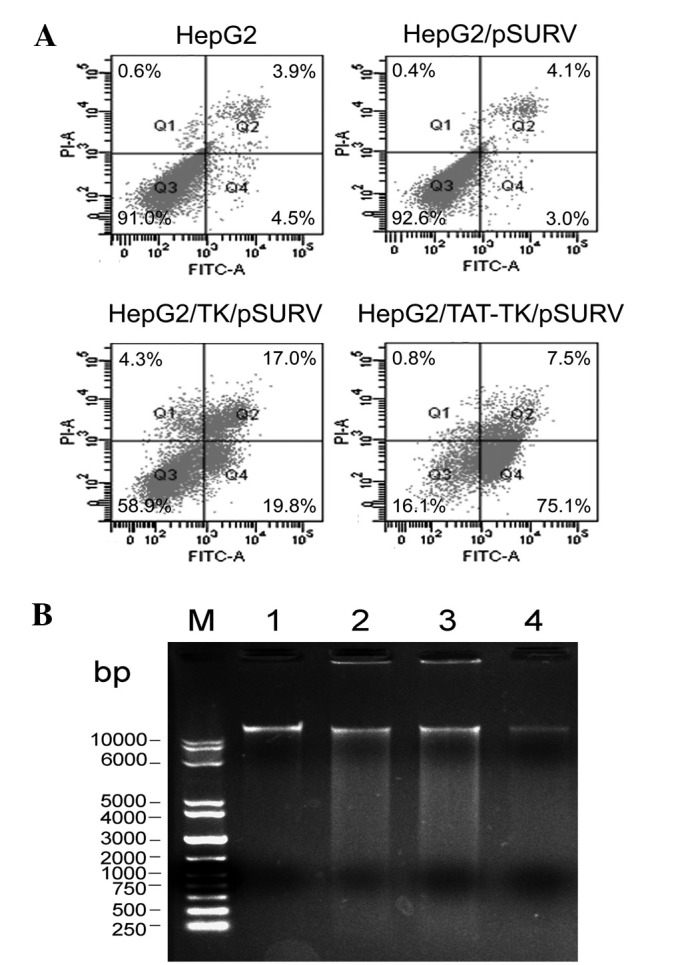
Analysis of HepG2 cell apoptosis. (A) Flow cytometric detection of HepG2 cell apoptosis. The points of the lower right quadrant represent apoptotic cells, and the points of the upper right quadrant represent necrotic cells. (B) Formation of DNA ladder. (M, molecular weight; lane 1, HepG2; lane 2, HepG2/TK/pSURV; lane 3, HepG2/TAT-TK/pSURV; lane 4, HepG2/pSURV).