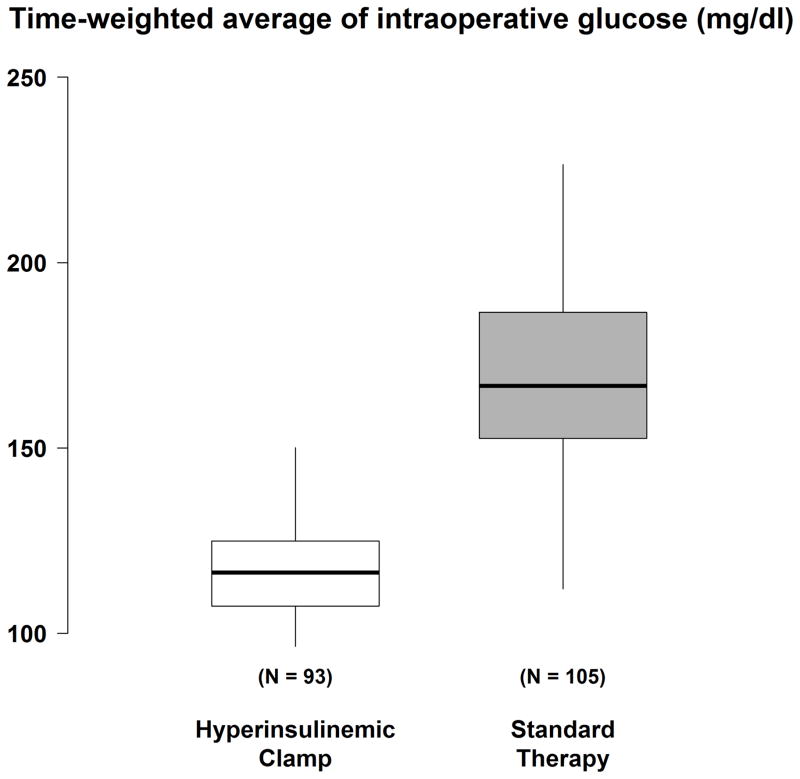
Figure 2.
Time-weighted average (TWA) glucose concentration in patients assigned the hyperinsulinemic-normoglycemic clamp and to routine glucose management. Results presented as boxplots: the first quartile, median, and third quartile comprise the boxes; whiskers extend to the most extreme observations within 1.5 times the interquartile range of the first and third quartiles, respectively.

