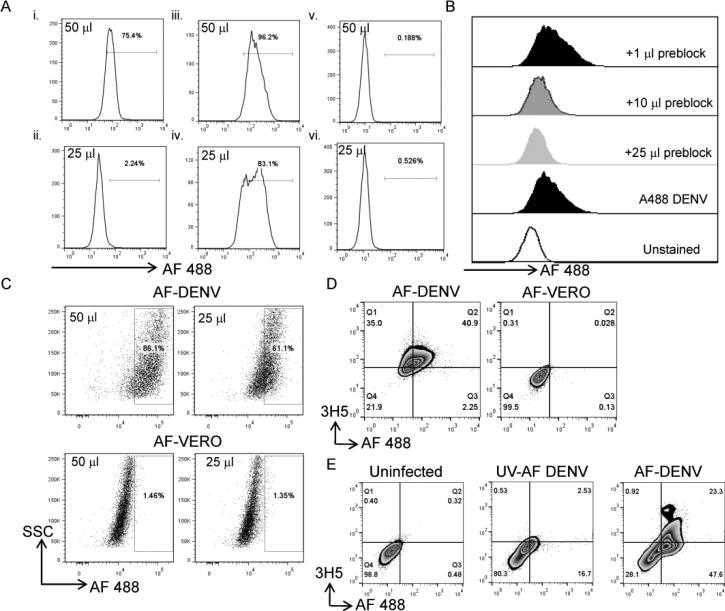
FIGURE 1. Binding characteristics of AF-DENV.
(A) Different concentrations of AF-DENV were added to the parental monocytic cell line U937 (i and ii) or to U937 transfected with DCSIGN (v and vi). AF-VERO binding was also assessed to U937-DC SIGN cells (iii and iv). Numbers adjacent to the gate in the histogram represent the percentage of AF-DENV+ or AF-VERO+ cells, respectively, in the corresponding cell lines. One of two independent experiments is shown. (B) Increasing concentrations of unlabeled DENV were added to U937-DCSIGN cells prior to the addition of AF-DENV. Histograms are shaded to emphasize the change in mean fluorescence intensity (MFI) with increasing concentration of unlabeled DENV. (C) U937-DCSIGN cells were infected with different concentrations of AF-DENV or AF-VERO, and intracellular fluorescence was assessed by flow staining 24 h later. Representative flow plots of one of three independent experiments are shown. (D) AF-DENV (left panel) and AF-VERO (right panel) -infected U937-DCSIGN cells were fixed and stained intracellularly for the dengue E protein using the 3H5 MAb 24 h post-infection. (E) Uninfected (left panel), UV AF-DENV (middle panel) and AF-DENV (right panel) -infected U937-DCSIGN cells were fixed and stained intracellularly for the dengue E protein using the 3H5 MAb 48 h post-infection.

