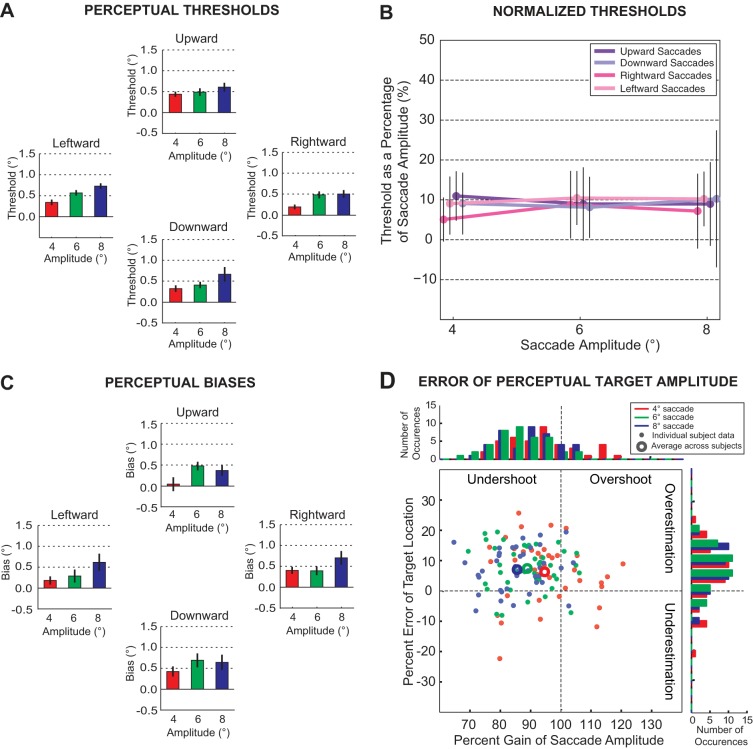
Fig. 3.
Perceptual performance for all subjects. A: perceptual threshold. Bar graphs represent the means and standard errors for perceptual threshold across subjects for all target amplitudes and directions (red: 4°, green: 6°, and blue: 8°). Saccade direction had no significant effect on threshold; however, perceptual threshold for all directions increased significantly with target amplitude. B: normalized threshold for each direction plotted against target amplitude. We derived normalized thresholds by scaling the perceptual threshold as a percentage of the mean primary saccade amplitude for each amplitude and direction. Mean normalized thresholds were ∼10% of movement amplitude. C: perceptual bias. Bar graphs represent the means and standard errors for perceptual bias (amount of displacement at chance level) across subjects for all target amplitudes and directions. D: percent gain of saccade amplitude and percent error estimation of target location. The percent error in the estimated target location is plotted as a function of percent gain in the saccade amplitude for all saccade amplitudes and directions. Horizontal and vertical movements are combined for each amplitude, and the larger symbols represent the respective mean percent gains in saccade amplitude and mean percent errors in target location estimation. The histograms to the right and above the plot are the respective distributions of the percent error and the percent gain.

