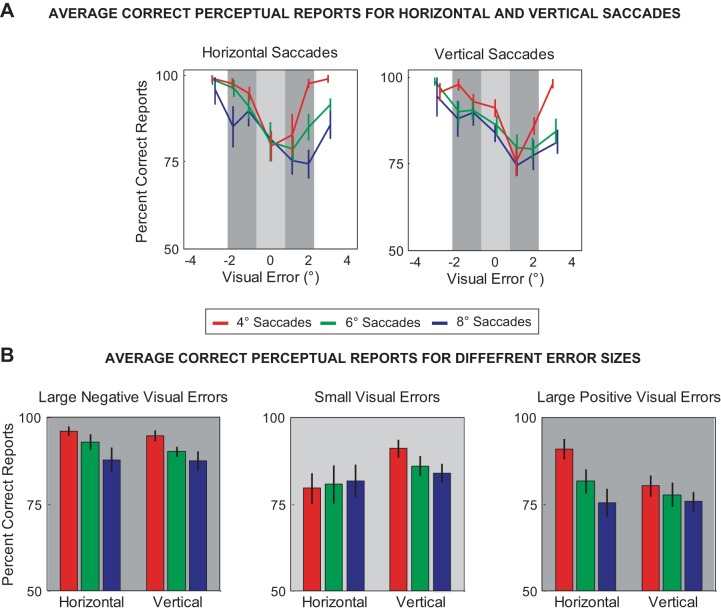
Fig. 5.
Visual error and perceptual judgment of shifted targets. The visual error with respect to the shifted target was quantified by taking the difference between the eye position at the time of target reappearance and the location of the shifted target. A: percentage of correct perceptual reports is plotted as a function of visual error for horizontal and vertical saccades for each target amplitude (red: 4°, green: 6°, and blue: 8°). B: bar graphs for the average percentage of correct reports for large negative (−2.25° to −0.75°), small (−0.75° to 0.75°), and large positive visual errors (0.75° to 2.25°). Error bars show SE.

