Fig. 2.
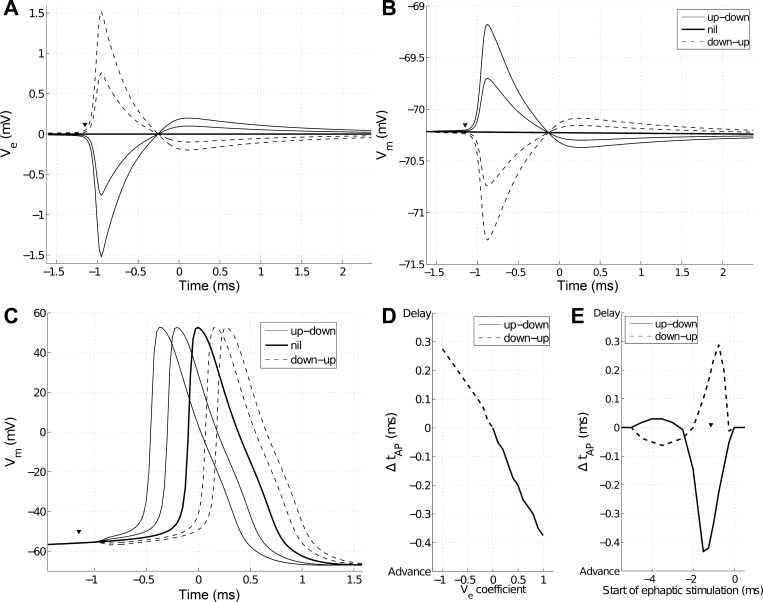
Ephaptic coupling in NEURON. A: stimulating potential Ve calculated 5 μm from stimulating neuron hillock. Additional traces were created by multiplying Ve by coefficients +0.5 (solid, thin trace), 0 (solid, thick trace), and −0.5 and −1 (dotted traces). B: ephaptic stimulation while receiving neuron is at resting membrane voltage (Vm). Receiving and stimulating neurons were separated by 10 μm. Arrowhead shows start of ephaptic stimulation. C: ephaptic stimulation while receiving neuron is close to threshold. Identical ephaptic stimulation as in B. The arrowhead shows the start of ephaptic stimulation. Up-down Vm deflections advance the spike, whereas down-up delay it. Time t = 0 corresponds to the peak of Vm with no ephaptic stimulation (nil). D: quantification of C. Data points are generated by multiplying stimulating Ve by a scalar coefficient between 1 and −1, as in A–C. E: effect of varying start of ephaptic stimulation (arrowheads in A–C) on spike timing. Both up-down (solid trace) and down-up (dashed trace) Vm deflections can advance and delay the spike. Arrowhead corresponds with arrowheads in A–C.

