Fig. 3.
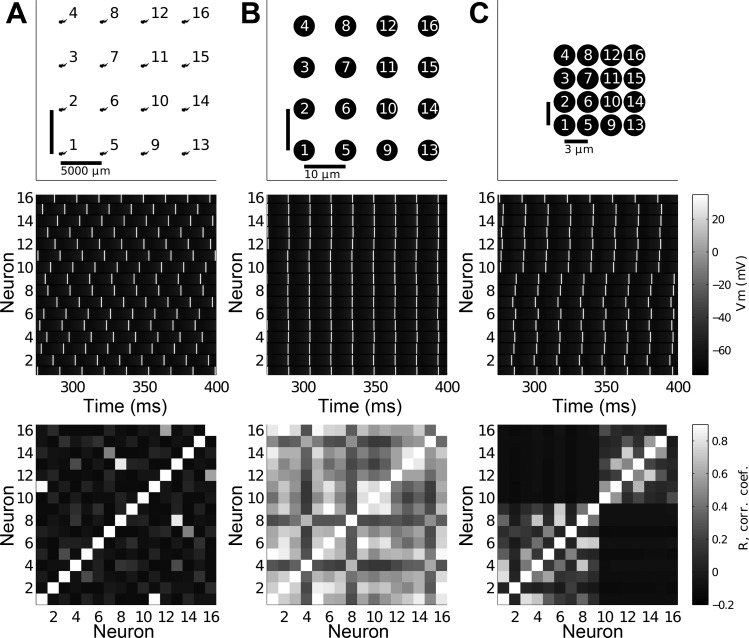
Ephaptically coupled network in NEURON. A: ephaptically coupled network of 16 neurons arranged in a square, 4 × 4 grid with 5,000 μm spacing. Top: schematic of laminar network. Neurons plotted to scale. Center: gray-scale plot of Vm for all 16 neurons. Vm color code is shown on the right of the figure; action potential peaks are white lines. Simulations were run in the NEURON environment. Bottom: pairwise correlations among all neurons in the network (Pearson correlation coefficient). B: same as A but for a network with 10 μm spacing. Top: for clarity, only somas are shown (not to scale). C: same as A but for a network with 3 μm spacing.

