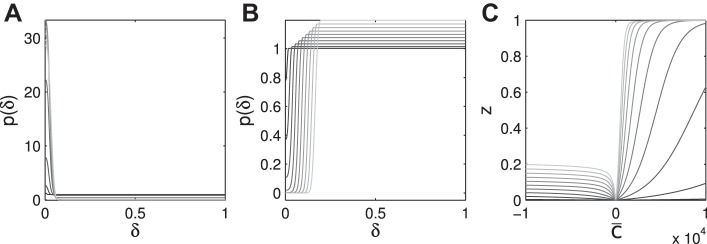
Fig. 4.

General conditions for synchrony. A and B: different effect of up-down vs. down-up ephaptic potentials (c̅ > 0 vs. c̅ < 0, respectively), coupling strength (absolute magnitude c̅), and different temporal profiles (ϕe) on synchrony of the phase difference distribution [p(δ)]. c̅ = +5,000 (A); c̅ = −5,000 (B). ϕe = 0.01, 0.02, … , 0.1 are indicated by shading from black to gray. C: mean z value for different c̅ (ϕe same as in other panels).
