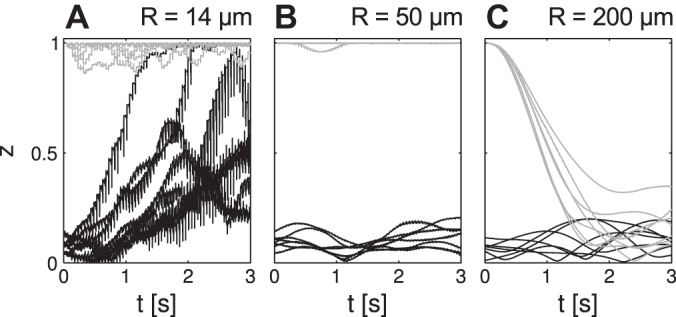
Fig. 7.

Hysteresis in population synchrony and asynchrony. N = 100 oscillators were started with all ϕ = 0 (gray lines) or with uniformly distributed ϕ (black lines). A: for low R, all simulations develop toward synchrony (z = 1). B: for intermediate R, the initial synchrony level persists. C: for high R, all simulations approach asynchrony (z close to 0). Simulation parameters: p+ = 1; N = 100; square geometry was used.
