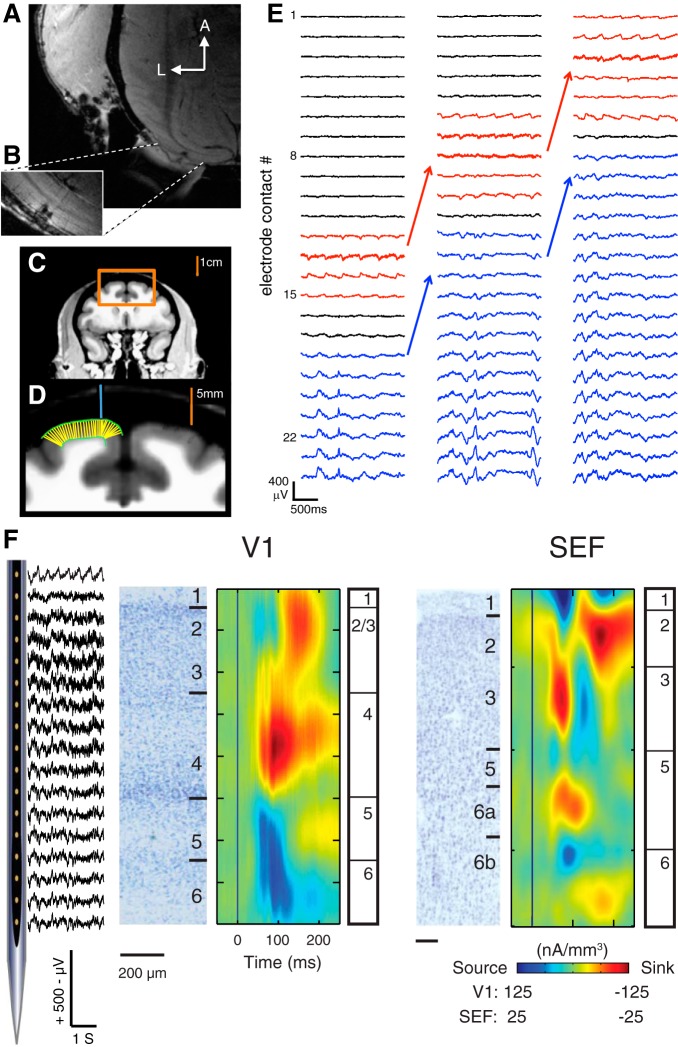
Fig. 1.
Laminar electrode placement. A: anatomical MR image of primary visual cortex (V1) after electrode removal, revealing penetration tracks. The implanted recording chamber can be seen extending caudally. B: magnified MRI scan of V1, showing 2 adjacent, parallel electrode penetration tracks. Note that the MR image does not directly show the cortical lesion but instead the larger magnetic field distortion (susceptibility artifact) caused by the cerebrospinal fluid that has entered the track. C: anatomical MR image of supplementary eye field (SEF). D: magnified image of region outlined in C. A CT scan of the linear microelectrode array inside the recording chamber (blue line) was coregistered with the MRI. After the boundaries between gray/white matter and gray matter/skull were manually drawn (green lines), an automated algorithm determined the perpendicular lines along the boundaries (thin yellow lines). Note the perpendicularity of the electrode to the cortical surface. E: recordings of physiological signals during electrode placement. The electrode was advanced ∼500 μm between successive recordings. Note the advancement of the electrocardiogram (red lines) and 1/f neural data (blue lines). F: schematic illustration of electrode configuration. Local field potentials (LFPs) were recorded simultaneously across layers of V1 or SEF with the linear multielectrode array. The location of each electrode channel was estimated by the visually evoked current source density (CSD) for each session, which was also used to align the data in depth across sessions. Grand average visually evoked CSDs are shown beside Nissl sections of V1 and SEF.

