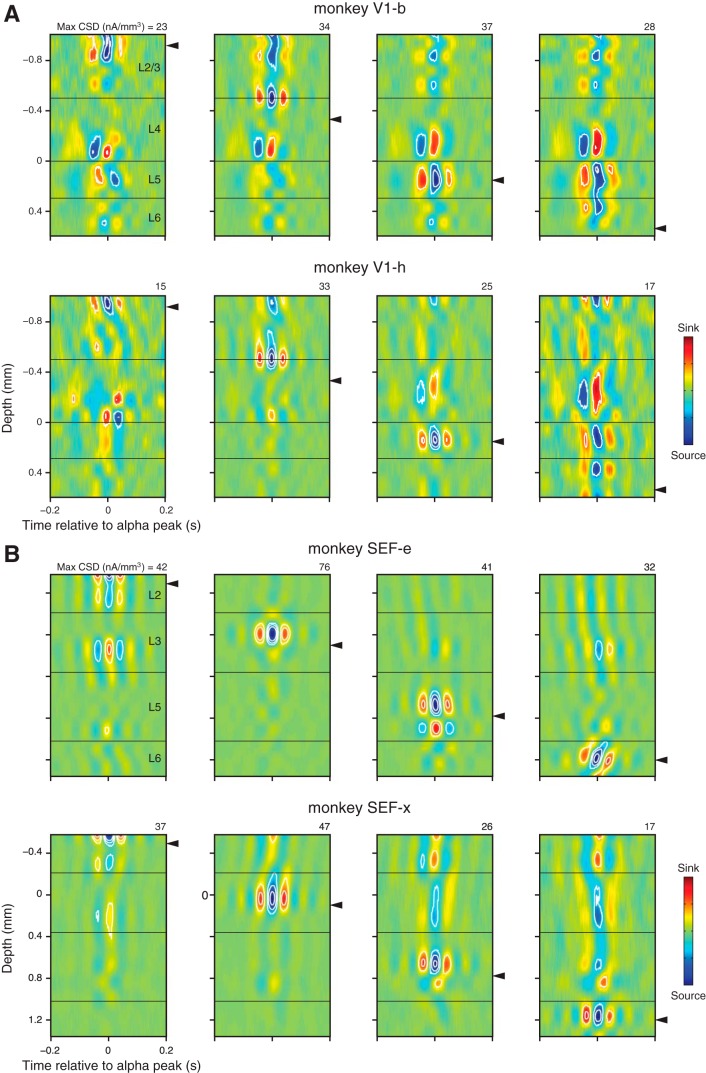
Fig. 10.
Alpha-aligned current source density. A: grand average laminar CSD aligned on alpha peak in V1 (monkey V1-b, n = 7 sessions; monkey V1-h, n = 8). Alpha reference in L2/3, L4, L5, or L6 from left to right (marked with arrowhead). Black lines indicate estimated laminar borders. Maximum current per unit volume is indicated at top right of each plot. White contours indicate statistically significant difference from zero (FDR-corrected P < 0.05). B: grand average laminar alpha-aligned CSD in SEF (SEF-e, n = 7; SEF-x, n = 9). All image conventions as in A. Note that interlaminar sink-source pairings were observed in V1 but not in SEF.

