Fig. 4.
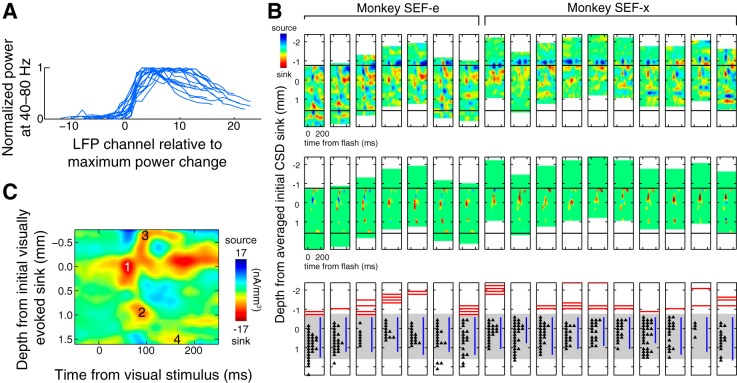
Linear multielectrode array depth alignment across sessions based on LFP frequency content. A: normalized SEF LFP power between 40 and 80 Hz across the multielectrode array for each recording session. Each blue line represents normalized gamma power from superficial to deep electrode channels (plotted left to right) from an individual session. Gamma LFP power was generally highest in superficial layers, with a gradual decrease in deep layers. Electrode channel numbers were reassigned relative to the channel at which the maximum change in power occurred (designated channel 0). The invariance of this transition in power across sessions is clear. B: depth alignment across monkeys and sessions. Top: visually evoked CSD. Middle: visually evoked CSDs masked for significance to show laminar locations of visually evoked sinks. Bottom: schematic representing each day's laminar position of the electrocardiogram signal (red), cortical depths at which 40–80 Hz LFP power exceeded the average 40–80 Hz power across all electrode channels (blue), and well-isolated single units (black triangles). Horizontal black bars and gray shading indicate the estimated location of gray matter. C: grand average visually evoked CSD after gamma-based depth alignment. Note the presence of initial current sinks in middle (1) and deep (2) layers followed by superficial (3) and deep (4) sinks. The similarity between this intersession average and that obtained after CSD-based alignment (Fig. 1F) demonstrates the reliability of assigning data to particular layers in SEF.

