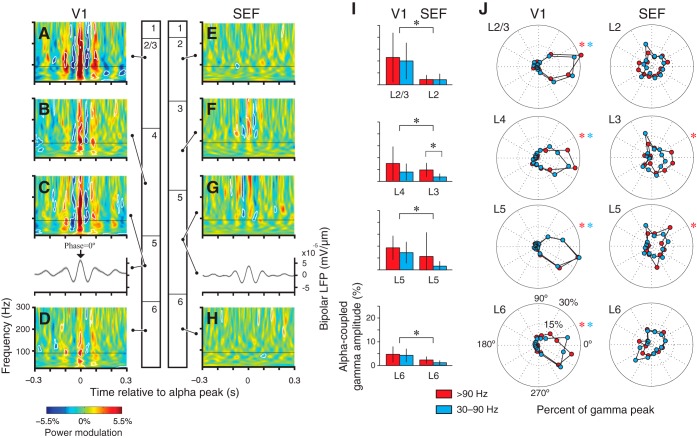
Fig. 5.
Statistical quantification of phase-amplitude coupling between L5 alpha and gamma across laminar compartments in V1 and SEF. A–D: TFRs for increasing cortical depth (top to bottom) for area V1. Cortical lamination diagram on right provides a key for the respective laminar compartment compartments. Each TFR panel shows the grand average amplitude modulation across frequency around alpha peaks of L5 in V1 (n = 15 sessions). White contours indicate significant modulation (random permutation test). Thin horizontal lines mark 90 Hz. E–H: same as A–D but for area SEF (n = 16). All TFRs are scaled to the maximum power modulation in SEF to facilitate interarea comparison. Insets below C and G show the average broadband bipolar LFP of the reference electrode channel (gray area = SE). I: laminar distributions of alpha-coupled gamma amplitude for 30–90 Hz (blue) and >90 Hz (red). Asterisks indicate statistical significance (ANOVA with area and frequency as factors using post hoc comparisons, P < 0.01 Bonferroni corrected). J: alpha phase-dependent distributions of gamma power. Blue dots mark the phase-dependent fraction of amplitude maxima in the 30–90 Hz range, and red denotes the frequency of gamma peaks >90 Hz. Asterisks indicate statistical significance (Rayleigh's test for nonuniformity, P < 0.01, Bonferroni corrected). Note the consistent relationship between alpha phase and gamma peaks in V1 compared with the inconsistent patterns in SEF.

