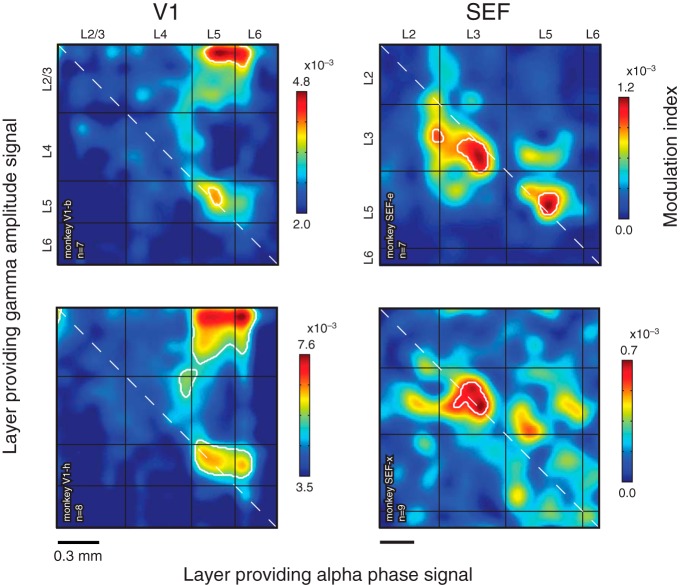
Fig. 9.
Laminar organization of phase-amplitude coupling in V1 and SEF shown for individual subjects. Matrices show Tort's MI averaged across cortical depth for alpha phase (x-axis) and gamma amplitude (y-axis). Borders of L2/3, L4, L5, and L6 in V1 and of L2, L3, L5, and L6 in SEF indicated by black lines. Number of averaged sessions is indicated at bottom left of each plot. Significant coupling is indicated by white contours (FDR-corrected P < 0.01). Note the similarities across monkeys within each area.

