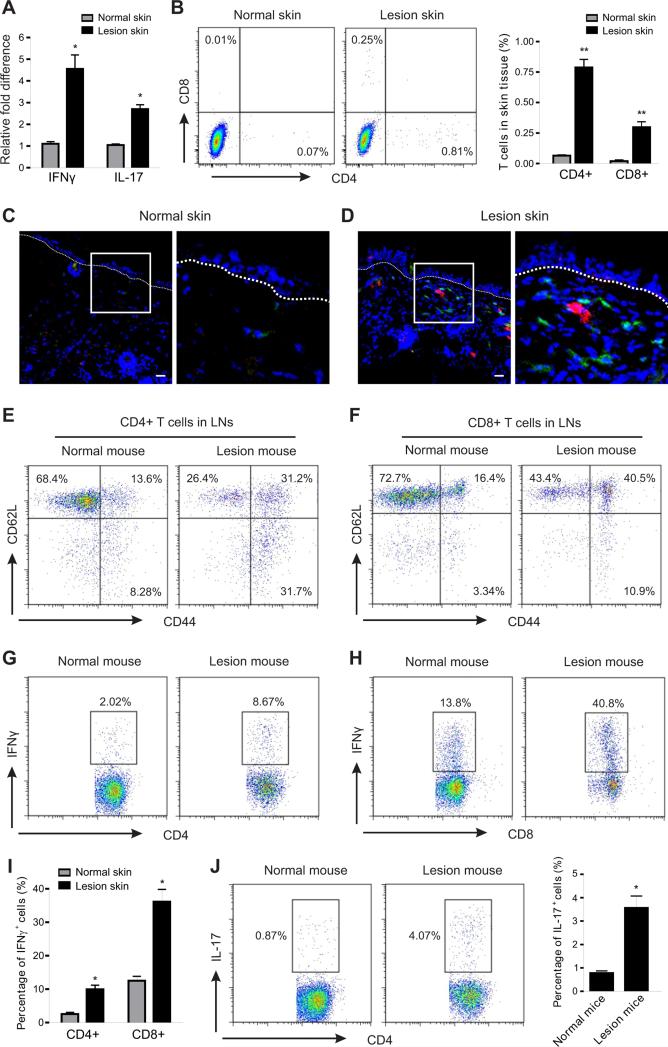
Figure 4. HFD-induced lesions are associated with enhanced T cell activation.
(A) Analysis of the relative mRNA levels of IFNγ and IL-17 in skin tissues from LFD-fed normal mice and HFD-fed lesion mice by real-time PCR (*, p<0.05).
(B) Flow cytometric analysis for CD4+ T cells and CD8+ T cells in skin epidermis of LFD-fed normal mice and HFD-fed lesion mice. Average percentage of T cells in skin epidermis is shown in the right panel (**, p<0.01).
(C-D) Frozen sections of skin tissues from LFD-fed normal mice and HFD-fed lesion mice were stained with CD4 mAb (green), CD8 mAb (red) and DAPI (blue) for confocal microscopic analysis. Magnified fields of selected areas are shown in the right panel of each figure. Scale bars represent 10μM.
(E-F) Flow cytometric analysis of the activation status of CD4+ T cells (E) and CD8+ T cells (F) in draining lymph nodes (LNs) from LFD-fed normal mice and HFD-fed lesion mice. Data represent one of three independent experiments with similar results.
(G-I) Analysis of IFNγ production in CD4+ T cells (G) and CD8+ T cells (H) of draining LNs from LFD-fed normal mice and HFD-fed lesion mice by intracellular staining. Average percentage of IFNγ+ cells in total CD4+ or CD8+ T cells is shown in panel I (*, p<0.05).
(J) Analysis of IL-17 production in CD4+ T cells of draining LNs from LFD-fed normal mice and HFD-fed lesion mice lesions by intracellular staining. Average percentage of IL-17+ cells in total CD4+ T cells is shown in the right panel (*, p<0.05).
Data are shown as mean ± SEM and representative of three experiments. See also Figure S3.

