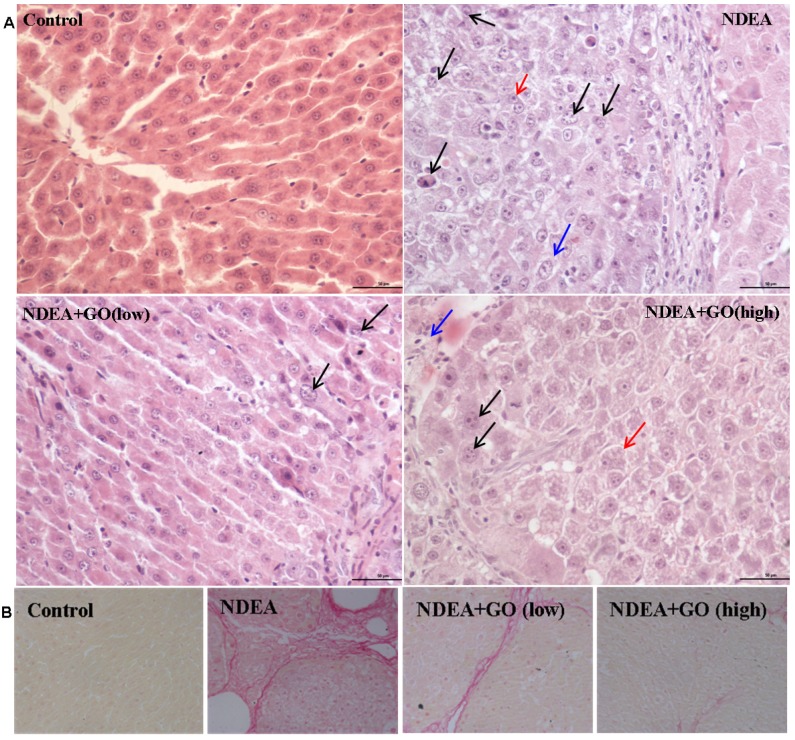
Figure 2.
Effect of GO and NDEA on the morphological changes in rat livers. The histological examinations were performed followed with standard protocols. A: H&E staining (×400). Bar: 50μm. ①NDEA group: Black arrow points to nuclear atypia. Blue arrow points to nucleus/cytoplasm ratio increase. Red arrow points to hepatocyte plate thickening. ② GO low dose treatment group: Black arrow points to nuclear atypia. ③ GO high dose treatment group: Black arrow points to nucleolus increase. Blue arrow points to inflammatory cell infiltration. Red arrow points to hepatocytes edema. B: Sirius red staining (×400). The sirius red-positive areas indicated significant liver fibrosis.

