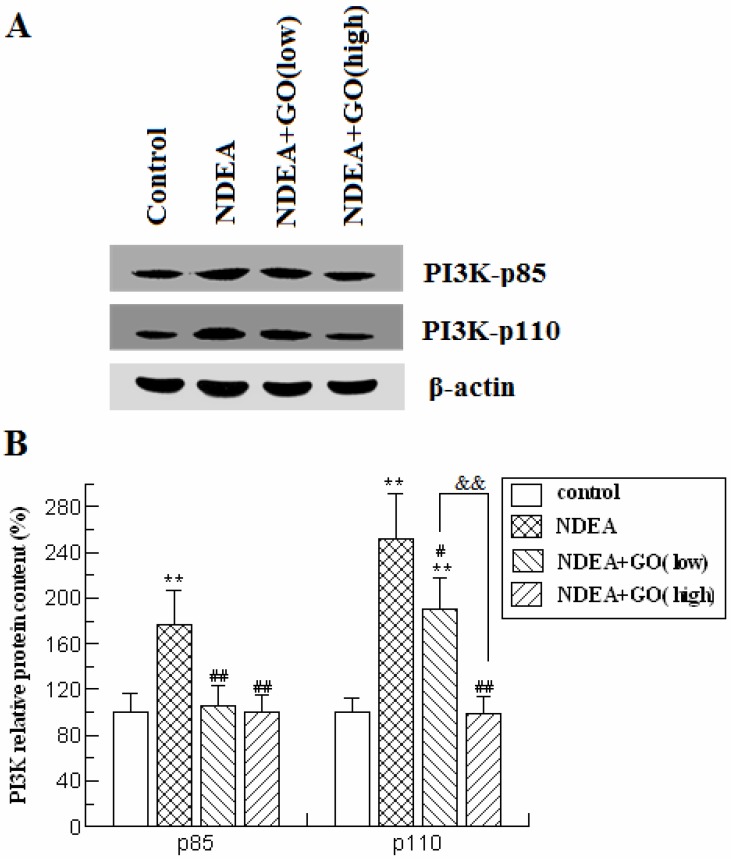
Figure 4.
Effect of GO and NDEA on PI3K-p85 and PI3K-p110 protein contents. A: A representative immunoblot. B: Data presented the expression of p85 and p110 as percentage of control group (mean ± SD) in triplicate. The protein levels were quantified with β-actin as an internal control. *P<0.05, **P<0.01, compared with control group; #P<0.05, ##P<0.01, compared with NDEA group; &&, P<0.01.

