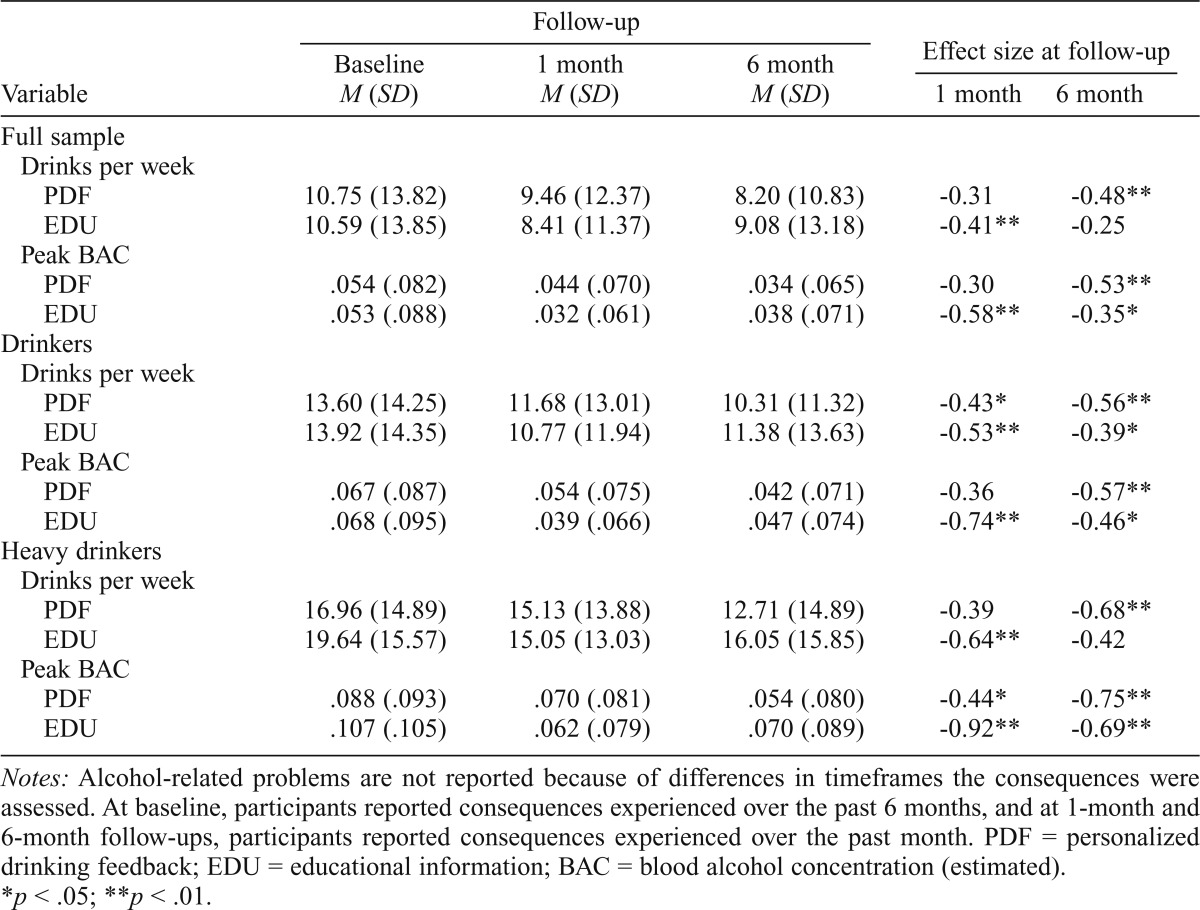
Table 1.
Means (and standard deviations) and within-person effect sizes (Cohen’s d) on outcomes by condition

| Follow-up |
Effect size at follow-up |
||||
| Variable | Baseline M (SD) | 1 month M (SD) | 6 month M (SD) | 1 month | 6 month |
| Full sample | |||||
| Drinks per week | |||||
| 10.75 (13.82) | 9.46 (12.37) | 8.20 (10.83) | -0.31 | -0.48** | |
| EDU | 10.59 (13.85) | 8.41 (11.37) | 9.08 (13.18) | -0.41** | -0.25 |
| Peak BAC | |||||
| .054 (.082) | .044 (.070) | .034 (.065) | -0.30 | -0.53** | |
| EDU | .053 (.088) | .032 (.061) | .038 (.071) | -0.58** | -0.35* |
| Drinkers | |||||
| Drinks per week | |||||
| 13.60 (14.25) | 11.68 (13.01) | 10.31 (11.32) | -0.43* | -0.56** | |
| EDU | 13.92 (14.35) | 10.77 (11.94) | 11.38 (13.63) | -0.53** | -0.39* |
| Peak BAC | |||||
| .067 (.087) | .054 (.075) | .042 (.071) | -0.36 | -0.57** | |
| EDU | .068 (.095) | .039 (.066) | .047 (.074) | -0.74** | -0.46* |
| Heavy drinkers | |||||
| Drinks per week | |||||
| 16.96 (14.89) | 15.13 (13.88) | 12.71 (14.89) | -0.39 | -0.68** | |
| EDU | 19.64 (15.57) | 15.05 (13.03) | 16.05 (15.85) | -0.64** | -0.42 |
| Peak BAC | |||||
| .088 (.093) | .070 (.081) | .054 (.080) | -0.44* | -0.75** | |
| EDU | .107 (.105) | .062 (.079) | .070 (.089) | -0.92** | -0.69** |
Notes: Alcohol-related problems are not reported because of differences in timeframes the consequences were assessed. At baseline, participants reported consequences experienced over the past 6 months, and at 1-month and 6-month follow-ups, participants reported consequences experienced over the past month. PDF = personalized drinking feedback; EDU = educational information; BAC = blood alcohol concentration (estimated).
p < .05;
p < .01.
