
Table 2.
Time × AmED Group interaction effects on drinking and consequences
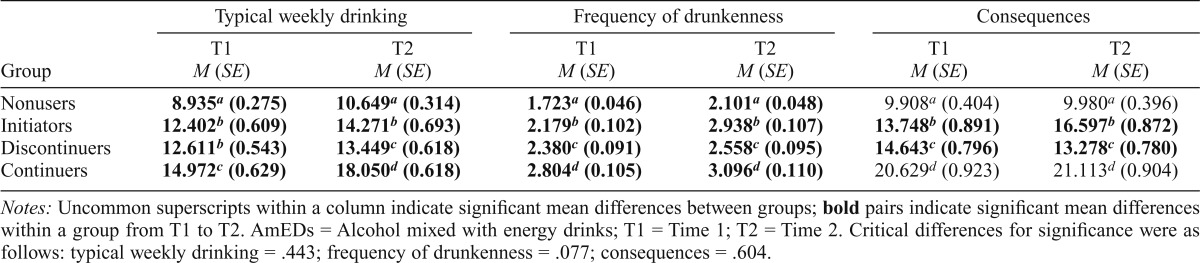
| Group | Typical weekly drinking |
Frequency of drunkenness |
Consequences |
|||
| T1 M (SE) | T2 M (SE) | T1 M (SE) | T2 M (SE) | T1 M (SE) | T2 M (SE) | |
| Nonusers | 8.935a (0.275) | 10.649a (0.314) | 1.723a (0.046) | 2.101a (0.048) | 9.908a (0.404) | 9.980a (0.396) |
| Initiators | 12.402b (0.609) | 14.271b (0.693) | 2.179b (0.102) | 2.938b (0.107) | 13.748b (0.891) | 16.597b (0.872) |
| Discontinuers | 12.611b (0.543) | 13.449c (0.618) | 2.380c (0.091) | 2.558c (0.095) | 14.643c (0.796) | 13.278c (0.780) |
| Continuers | 14.972c (0.629) | 18.050d (0.618) | 2.804d (0.105) | 3.096d (0.110) | 20.629d (0.923) | 21.113d (0.904) |
Notes: Uncommon superscripts within a column indicate significant mean differences between groups; bold pairs indicate significant mean differences within a group from T1 to T2. AmEDs = Alcohol mixed with energy drinks; T1 = Time 1; T2 = Time 2. Critical differences for significance were as follows: typical weekly drinking = .443; frequency of drunkenness = .077; consequences = .604.