
Table 7.
Differences among the alcohol involvement latent classes on the sociodemographic variables in the full Wave I sample (adolescents assigned to most probable class)
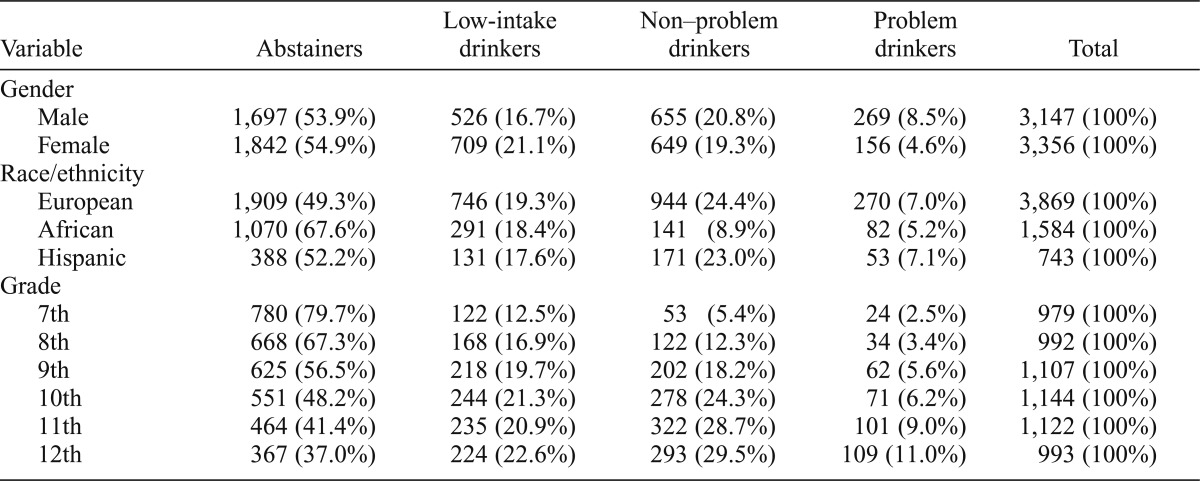
| Variable | Abstainers | Low-intake drinkers | Non–problem drinkers | Problem drinkers | Total |
| Gender | |||||
| Male | 1,697 (53.9%) | 526 (16.7%) | 655 (20.8%) | 269 (8.5%) | 3,147 (100%) |
| Female | 1,842 (54.9%) | 709 (21.1%) | 649 (19.3%) | 156 (4.6%) | 3,356 (100%) |
| Race/ethnicity | |||||
| European | 1,909 (49.3%) | 746 (19.3%) | 944 (24.4%) | 270 (7.0%) | 3,869 (100%) |
| African | 1,070 (67.6%) | 291 (18.4%) | 141 (8.9%) | 82 (5.2%) | 1,584 (100%) |
| Hispanic | 388 (52.2%) | 131 (17.6%) | 171 (23.0%) | 53 (7.1%) | 743 (100%) |
| Grade | |||||
| 7th | 780 (79.7%) | 122 (12.5%) | 53 (5.4%) | 24 (2.5%) | 979 (100%) |
| 8th | 668 (67.3%) | 168 (16.9%) | 122 (12.3%) | 34 (3.4%) | 992 (100%) |
| 9th | 625 (56.5%) | 218 (19.7%) | 202 (18.2%) | 62 (5.6%) | 1,107 (100%) |
| 10th | 551 (48.2%) | 244 (21.3%) | 278 (24.3%) | 71 (6.2%) | 1,144 (100%) |
| 11th | 464 (41.4%) | 235 (20.9%) | 322 (28.7%) | 101 (9.0%) | 1,122 (100%) |
| 12th | 367 (37.0%) | 224 (22.6%) | 293 (29.5%) | 109 (11.0%) | 993 (100%) |