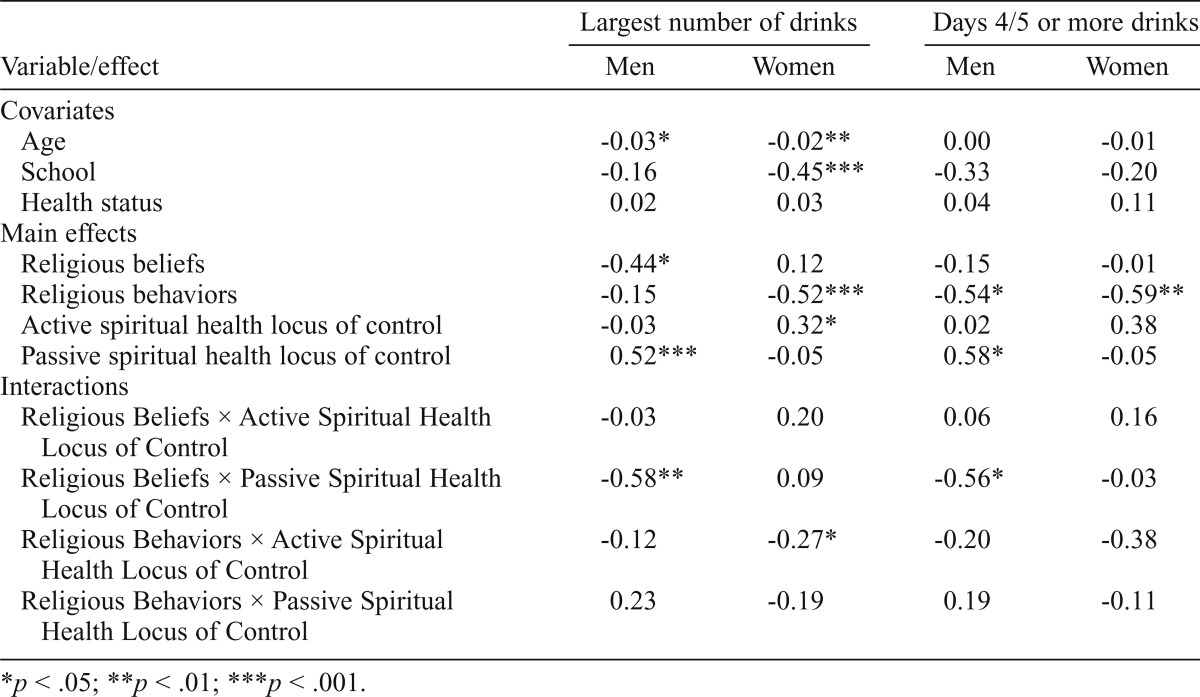
Table 3.
Estimates from ordinary least squares regression analyses for heavy drinking

| Variable/effect | Largest number of drinks |
Days 4/5 or more drinks |
||
| Men | Women | Men | Women | |
| Covariates | ||||
| Age | -0.03* | -0.02** | 0.00 | -0.01 |
| School | -0.16 | -0.45*** | -0.33 | -0.20 |
| Health status | 0.02 | 0.03 | 0.04 | 0.11 |
| Main effects | ||||
| Religious beliefs | -0.44* | 0.12 | -0.15 | -0.01 |
| Religious behaviors | -0.15 | -0.52*** | -0.54* | -0.59** |
| Active spiritual health locus of control | -0.03 | 0.32* | 0.02 | 0.38 |
| Passive spiritual health locus of control | 0.52*** | -0.05 | 0.58* | -0.05 |
| Interactions | ||||
| Religious Beliefs × Active Spiritual Health Locus of Control | -0.03 | 0.20 | 0.06 | 0.16 |
| Religious Beliefs × Passive Spiritual Health Locus of Control | -0.58** | 0.09 | -0.56* | -0.03 |
| Religious Behaviors × Active Spiritual Health Locus of Control | -0.12 | -0.27* | -0.20 | -0.38 |
| Religious Behaviors × Passive Spiritual Health Locus of Control | 0.23 | -0.19 | 0.19 | -0.11 |
p < .05;
p < .01;
p < .001.
