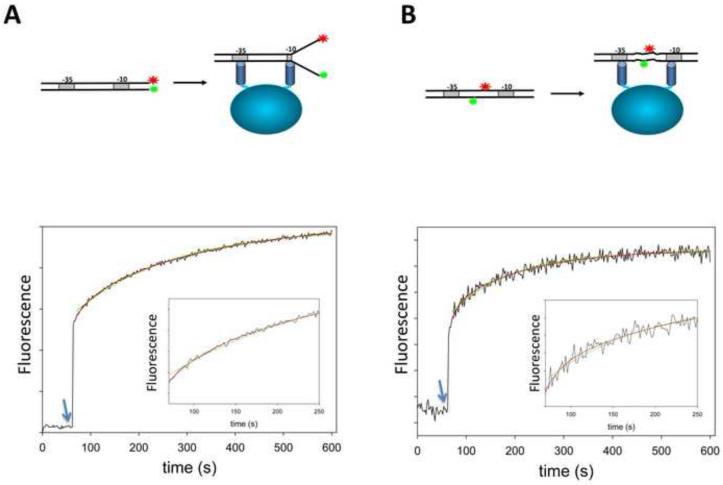
Figure 6.
Comparison of the kinetics of the melting of promoter DNA (A) and the deformations in the spacer DNA detected by FRET (B) between fluorescence probes placed in the constructs as schematically illustrated in panels A and B, respectively. Arrows depict time points of the addition of RNAP to a cuvette containing fluorescent promoter construct. Green and red lines correspond to nonlinear fits to single and double exponential kinetic models, respectively.

