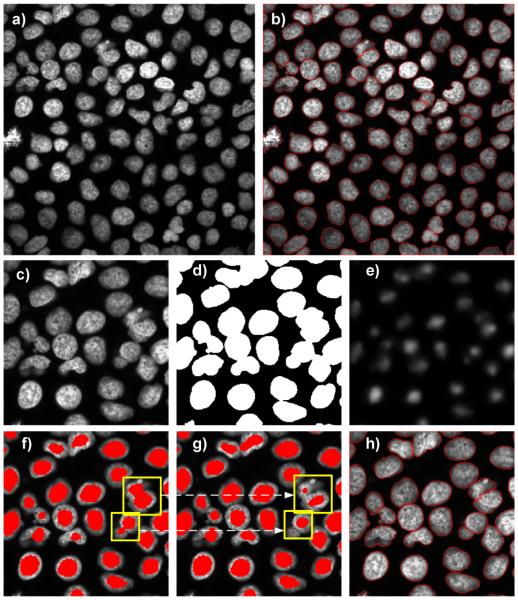
Figure 4.
Illustration of 3-D nuclei segmentation with subsequent processing steps: a) mid optical section of a 3-D image cube and b) final segmentation results. c) shows a close-up view of the upper-left quarter of a). Binary mask separating nuclei from background is shown in d), and the respective top-hat enhanced radial symmetry Ŝ in e). Seeds are marked in red. f) shows seed placement after the coarse step, and g) shows seeds detected in the fine mode. Bounding boxes (yellow) in f) indicate areas with clustered or in-close-proximity nuclei that were not separated by the seeded watershed segmentation. Clustered nuclei were recognized by shape and volume features and then pushed through the fine stage of seeds placement g). Seeds detected in g) replace seeds detected in f). Final nuclei delineation by the seeded watershed using seeds from g) is presented in h).

