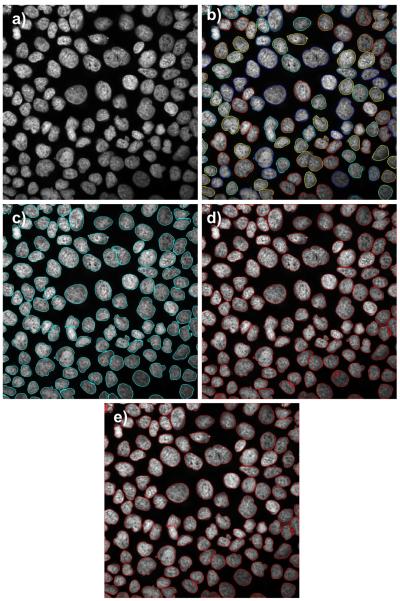
Figure 8.
A comparison of nuclei segmentation by different methods in moderate-to-high confluency cells set from Huh-7 cell line treated with a low drug dose: a) original image, b) LSetCelTrk, c), Farsight, and d) H-minima shape marking, and e) 3D-RSD method. Note heterogeneity of nuclear shape Image contrast is slightly stronger when compared to that in Figure 7.

