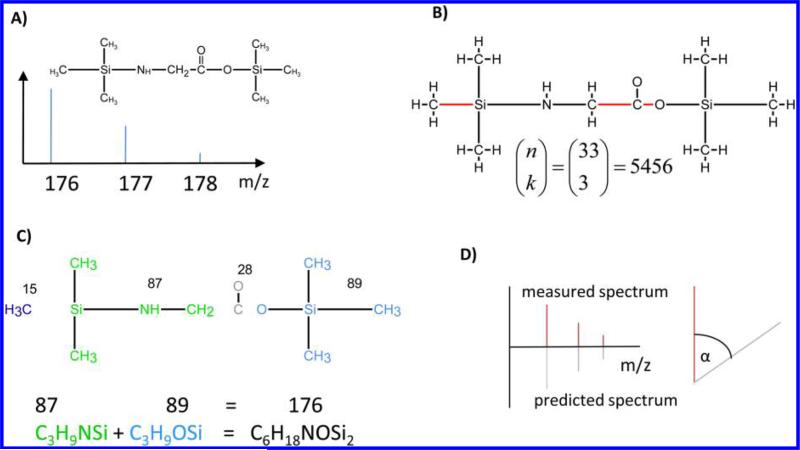
Figure 2.
Overview of the algorithm. (A) As input FFC needs the 2D structure of the compound together with the mass spectrum of the ion of interest. In this example, we present the molecule N,O-bis-(trimethylsilyl)-glycine (219 Da) and the fragment ion at mass 176. (B) 2D Structure is first converted into a molecular graph. The graph contains 34 vertices and 33 edges. Then all combinations of edge sets of a certain size (in this case 3) are consecutively deleted from the graph, resulting in 5456 disconnected graphs, one for each edge set deleted. The number of resulting subgraphs can be calculated with the binomial coefficient, where n corresponds to the number of edges and k corresponds to the cut size (eq 3). For simplification, only the edge set leading to the correct fragmentation is shown here. (C) For each disconnected graph, the connected components are determined. For every combination of connected components where the molecular masses sum up to the mass of the fragment ion, the atoms of these components are combined to build up a candidate formula. In this example, the connected components shown in green and light blue with the masses 87 and 89 sum up to the target mass of 176. The candidate formula is then C6H18NO2Si2, which is indeed the correct formula for this fragment ion. In addition to the chemical formula, the algorithm also yields positional information about the fate of specific atoms. For example, the carboxyl carbon of the original glycine molecule is lost in this fragment ion. (D) On the basis of the candidate formula, the theoretical mass spectrum is predicted and a spectrum similarity score to the measured spectrum based on the dot product17 is calculated. This is of special importance if more than one sum formula can be derived for the target mass.

