
Figure 3.
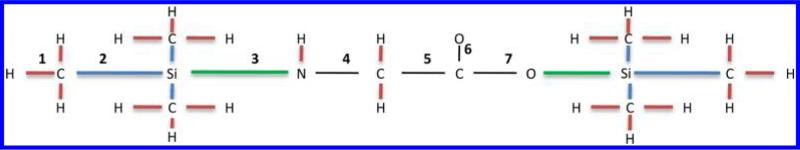
Graph representation of N,O-bis-(trimethylsilyl)-glycine. The graph contains 33 edges. For a cut size of three, the number of distinct edge pairs to delete is 5456. To reduce the number of distinct edge pairs, non backbone edges (edges that are not connected to at least one backbone atom) are grouped based on their loss pattern. For example, edges shown in red are grouped together because their removal leads to the loss of one hydrogen. The group of edges shown in blue leads to the loss of a methyl group when one of these edges is removed. The group of edges shown in green lead to the loss of a TMS group when one of these edges is removed. After reduction to relevant backbone edges, the graph now contains only 7 distinct edge groups (as illustrated by the numbers above the edges) which reduces the number of distinct edge sets of size 3 from 5456 to 35.