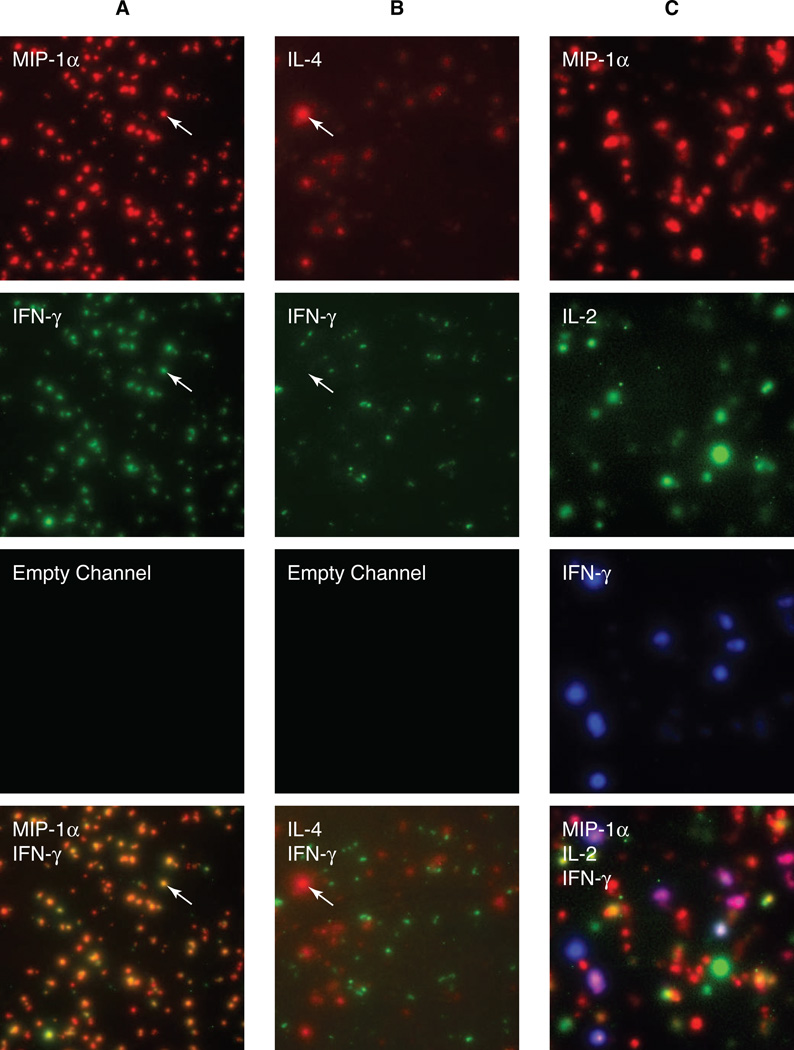
Figure 1. Two- and three-color Fluorospot assays detect various cell phenotypes.
A) 2×10³ Th1 cells per well were restimulated in a Fluorospot assay for MIP-1α (red, Cy3) and IFN-γ (green, Cy2). B) 2×10³ Th1 and 7×10³ Th2 cells per well were restimulated in a Fluorospot assay for IL-4 (red, Cy3) and IFN-γ (green, Cy2). C) CD4 T cells expressing a range of cytokine secretion phenotypes were restimulated in a Fluorospot assay for IL-5 (red, Cy3), IL-2 (green, Cy2) and IFN-γ (blue, Cy5). The top three rows show single-channel images for red, green and blue, and the bottom rows show the composite images.

