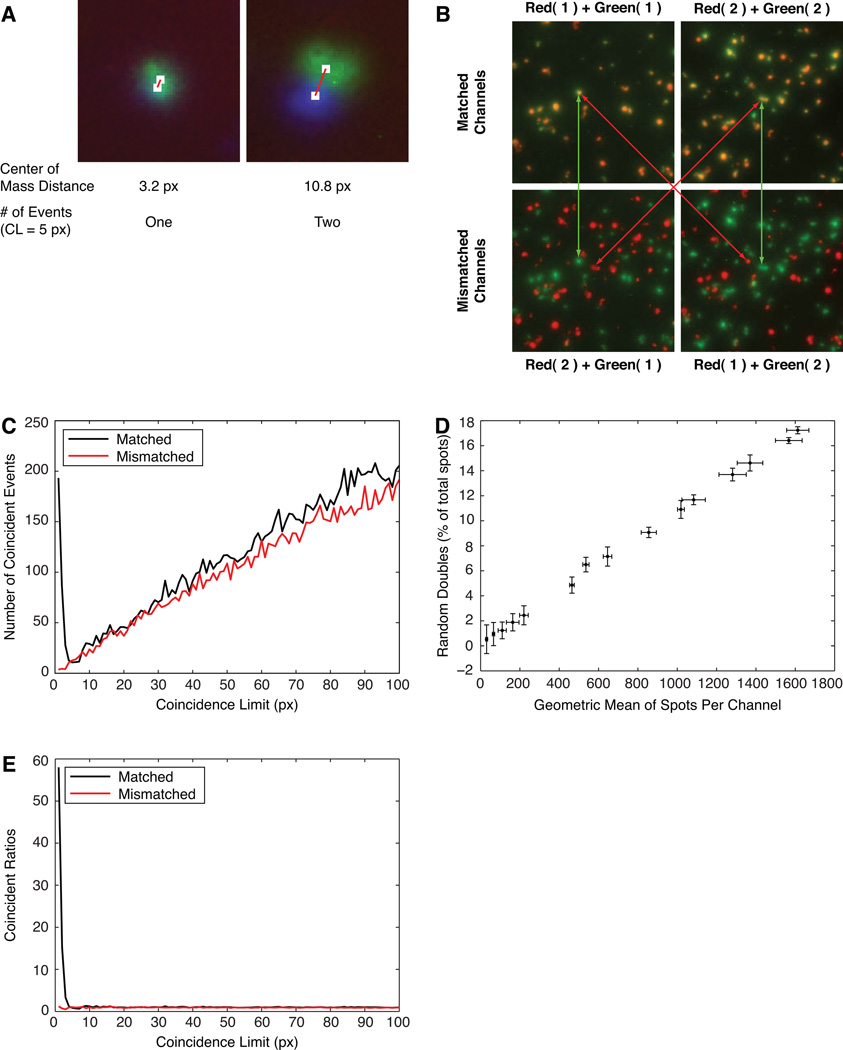
Figure 3. Assignment and analysis of coincidence limits using matched and mismatched images.
Images were used from the experiments shown in Figure 1C (A) or Fig. 1A (B, C, D, E). A) Assignment of a coincidence limit (CL) for two pairs of spots. At CL=5 pixels, the green and blue spots would be considered as one (left) or two (right) events. B) Effect of matching and mismatching the red and green channels of duplicate wells in the two-color MIP-1α and IFNγ assay (most are genuine double-producers). C) The number of apparent double-producers found at different values of the coincidence limit, using the matched and mismatched wells shown in B. D) The frequency of random doubles with increasing numbers of spots per well, estimated from mismatched images. E) The coincidence curves comparing ratios for ‘predicted random’ to actual matched and mismatched images.

