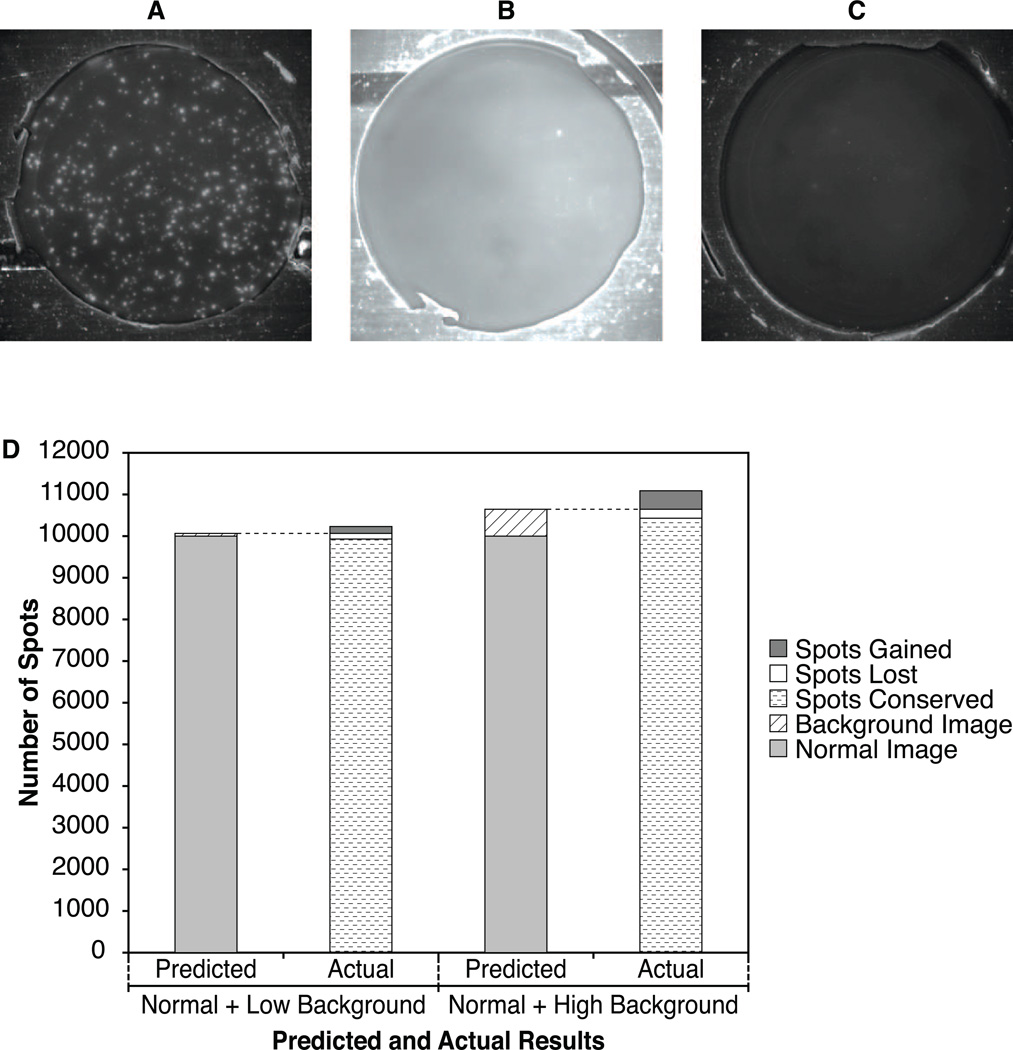
Figure 6. Examples of Normal, Low, and High Background.
A) Normal image: Image data from a Th1 IFNγ Fluorospot plate. B) Low Background image: Image data from a negative control well from same Th1 IFN-γ Fluorospot plate. C) High Background image: Image data from a separate Th1 IFNγ experiment with high background and low spot count. For display purposes, all three original images have been enhanced by equal brightness adjustments, but all calculations were performed on the original images. D) Fidelity of spot-finding in the presence of increased background.

