Figure 2.

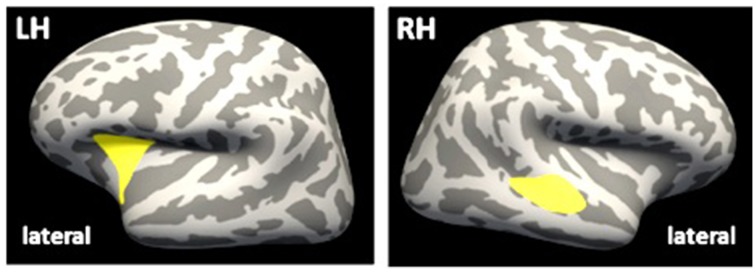
Differences in CT between groups. Inflated brain, lateral view. Yellow clusters indicate significant lower CT in mTBI group, as compared to control group. LH, left hemisphere; RH, right hemisphere; CT, cortical thickness.

Differences in CT between groups. Inflated brain, lateral view. Yellow clusters indicate significant lower CT in mTBI group, as compared to control group. LH, left hemisphere; RH, right hemisphere; CT, cortical thickness.