
FIGURE 3.
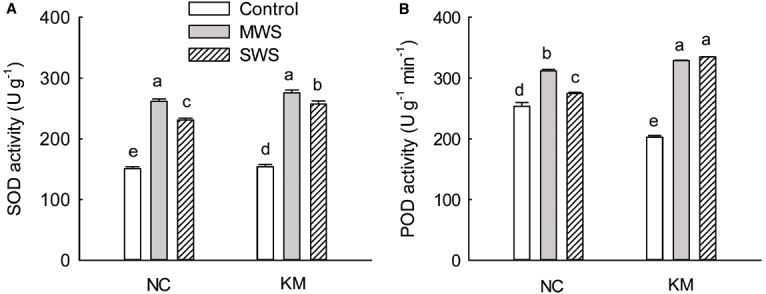
Changes in the SOD (A) and POD (B) activities in provenance NC, which grows in a higher rainfall area, and provenance KM, which grows in a lower rainfall area, subject to three different drought treatments (control: watered and maintained at 75% field capacity; MWS: moderate water stress, watered and maintained at 50% field capacity; SWS: severe water stress, watered and maintained at 30% field capacity). Values are the mean ± SD (n = 3). Similar letters indicate non-significant differences among treatments and between provenances at p < 0.05 according to Mann–Whitney test.