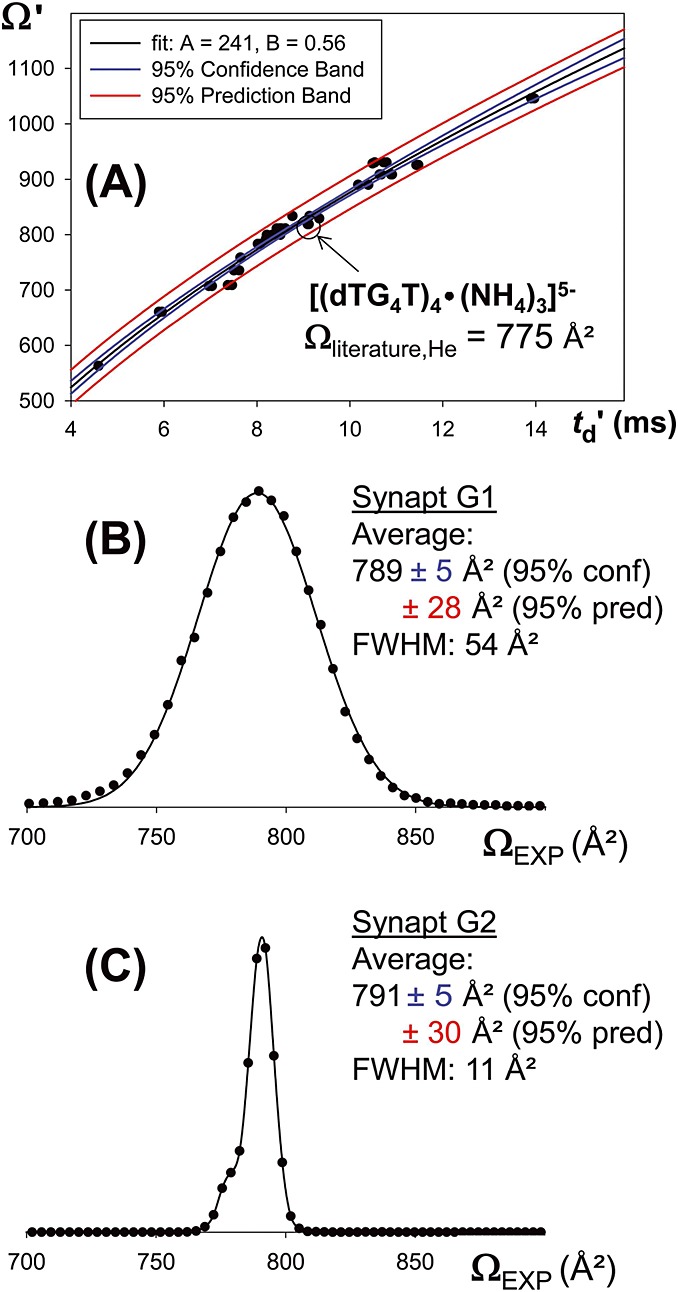
Figure 4.

(A): Oligonucleotide-based calibration curve for the Synapt G2 HDMS The datapoint of the structure of interest is circled: it falls outside the 95% confidence band and inside the 95% prediction band. Ωliterature refers to data of reference [20] (B): Reconstructed collision cross section distributions for the ion [(dTG4T)4•(NH4)3]5− on the Synapt G1 and (C) Reconstructed collision cross section distributions for the ion [(dTG4T)4•(NH4)3]5− on the Synapt G2. Summary collision cross section data of the main peak.
