
Figure 6.
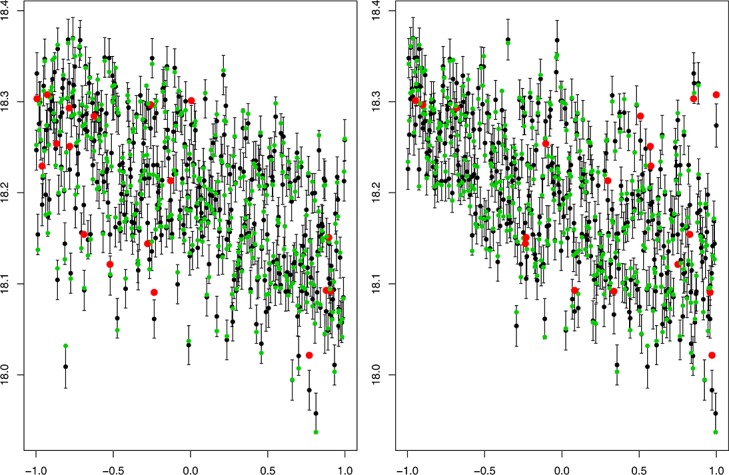
Traditional Leave One Out plots against the coefficient of Langmuir cells (left) and a coefficient controlling vertical eddies (right). The predictions and two standard deviation prediction intervals for the left out points are in black. The true values are in either green, if they are within two standard deviations of the prediction, or red otherwise