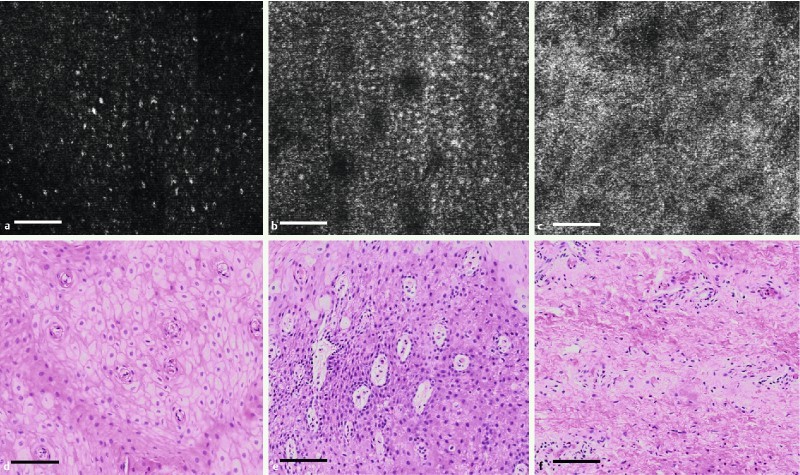
Fig. 3.

High-magnification SECM images (a, b, c) and representative, nearby en face histologic images (d, e, f) of swine esophagus. SECM images were taken from the regions marked by the boxes 1, 2, and 3 in Fig. 2 a. a and d Stratified squamous epithelium; b and e basal cell layer; c and f lamina propria (scale bar = 100 µm).
